Published on: 2025-12-30
Updated on: 2026-05-21
Stock prices move for clear reasons: how much a company earns, how fast it can grow, the cost of money, and how investors weigh risk. The stock market turns those forces into daily quotes through auctions, order books, and rules set by exchanges and regulators. Readers who understand the language behind those mechanics read charts, headlines, and earnings reports with less guesswork.
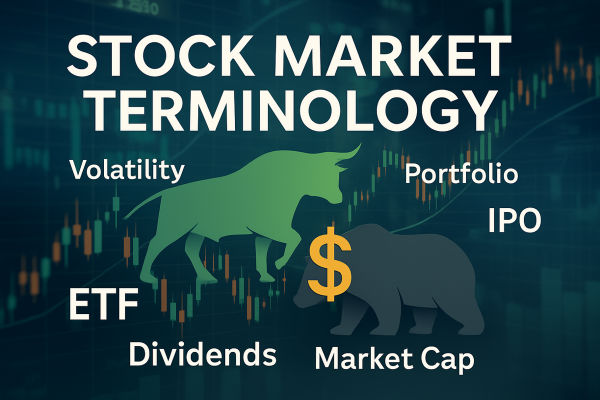
Stock market terminology is the practical vocabulary that explains how trades are placed, how prices are formed, how returns are measured, and how risk is managed. It covers everything from basic ideas like shares and dividends to technical terms like limit orders, bid-ask spread, market capitalization, and short interest. Without that vocabulary, two investors can look at the same price move and reach completely different conclusions.
This guide organizes stock market terminology into plain-English definitions that match how the market actually works. It is designed for long-term investors and active traders who want a single reference they can return to when a term appears in a platform, a filing, or a market update.
Stock market terminology is the set of words and phrases used to describe the buying and selling of shares, the way markets operate, and the tools investors use to evaluate companies and manage risk. It includes trading terms (orders, liquidity, spreads), investing terms (valuation, dividends, returns), and market structure terms (exchanges, settlement, volatility).
In practice, stock market terminology acts like a shared “operating language.” It helps investors interpret price quotes, understand how an order will execute, compare companies using consistent metrics, and avoid common mistakes caused by misunderstandings of basic mechanics such as leverage, margin, and stop orders.
The table below lists the most common stock market terminology readers see in everyday investing: on broker screens, in company results, and in market summaries. These are the core terms that explain price quotes, trade execution, and the basic measures used to compare stocks.
Each entry is written to be quick to scan. Readers can use the table as a fast glossary, then use the full master list later in the article for deeper or more specialized terms.
| No. | Term | Where You See It Most | Definition |
|---|---|---|---|
| 1 | Stock | Investing basics, brokerage apps | A stock is an ownership stake in a company. Buying stock means you own a small part of the business and may benefit from price gains and dividends, depending on company policy and performance. |
| 2 | Share | Trade confirmations, holdings | A share is one unit of a company’s stock. If you own 20 shares, you own 20 units of that company’s equity, and your profit or loss changes as the share price moves. |
| 3 | Exchange | Market listings, order routing | An exchange is an organized marketplace where securities are listed and traded under set rules. Exchanges match buyers and sellers and publish prices and volume for transparency. |
| 4 | Ticker Symbol | Quotes, charts, news, screeners | A ticker symbol is a short code that identifies a publicly traded security on an exchange. It is used to pull quotes, charts, filings, and trading data quickly and accurately. |
| 5 | IPO (Initial Public Offering) | Company listings, market news | An IPO is the first time a private company sells shares to the public and becomes listed on an exchange. After an IPO, the stock price is set by market demand and supply. |
| 6 | Market Capitalization | Company comparisons, index rules | Market capitalization is a company’s total market value, calculated as share price multiplied by shares outstanding. It is used to classify companies as large cap, mid cap, or small cap. |
| 7 | Index | Benchmarks, ETFs, performance reports | An index tracks the performance of a selected group of securities. It is used as a benchmark to judge returns, risk, and market direction, such as broad market or sector performance. |
| 8 | ETF | Long term investing, tactical trading | An ETF is a fund that trades on an exchange like a stock. Most ETFs track an index or theme, giving diversified exposure through one ticker with intraday pricing. |
| 9 | Portfolio | Account overview, wealth planning | A portfolio is the complete set of investments you own, such as stocks, bonds, funds, and cash. Portfolio results depend on asset mix, position sizes, and how holdings move together. |
| 10 | Asset Allocation | Retirement planning, risk profiles | Asset allocation is how a portfolio is split across asset classes like stocks, bonds, cash, and commodities. It is a main driver of long run risk and return because it shapes overall exposure. |
| 11 | Diversification | Risk control, portfolio construction | Diversification means spreading investments across different assets, sectors, and regions to reduce the impact of one position or one market shock. It aims to lower portfolio risk without relying on one idea. |
| 12 | Dividend | Stock research, income investing | A dividend is a payment a company makes to shareholders, usually from profits. Dividends can be paid in cash or shares and are often used to support income focused investment strategies. |
| 13 | Earnings | Company results, valuation models | Earnings are a company’s profits over a period. Traders and investors watch earnings because they influence valuation, dividends, reinvestment capacity, and market expectations about future growth. |
| 14 | P/E Ratio (Price To Earnings) | Stock valuation, screeners | The P/E ratio compares a stock’s price to its earnings per share. It is used to gauge how expensive a stock is relative to its profits, but it must be compared with peers and growth outlook. |
| 15 | Return | Performance reports, strategy review | Return is the gain or loss on an investment over a period, often shown as a percentage. Return includes price movement and may include dividends, depending on how performance is calculated. |
| 16 | Bull Market | Market commentary, long term cycles | A bull market is a period when prices rise over time and investor confidence is generally positive. Bull markets often feature stronger risk appetite, higher valuations, and momentum in growth expectations. |
| 17 | Bear Market | Risk periods, drawdown analysis | A bear market is a sustained decline in prices with weak sentiment and higher uncertainty. It often coincides with tighter financial conditions, weaker earnings expectations, or recession risk. |
| 18 | Correction | Market pullbacks, risk discussions | A correction is a notable decline from a recent peak, often viewed as a reset after a strong run. Corrections can be short and sharp, or slow and grinding, depending on liquidity and sentiment. |
| 19 | Volatility | Risk metrics, options pricing | Volatility measures how much and how fast prices move up and down. Higher volatility increases risk and potential opportunity, and it often requires smaller position sizes and wider stops to avoid random exits. |
| 20 | Liquidity | Trading costs, execution quality | Liquidity is how easily an asset can be bought or sold without moving its price much. High liquidity usually means tighter spreads, deeper order books, and more reliable fills. |
| 21 | Volume | Charts, breakouts, confirmations | Volume is the number of shares or contracts traded in a period. Rising volume often signals stronger participation, and many traders use volume to confirm breakouts, trends, or reversals. |
| 22 | Bid | Quote screen, order tickets | The bid is the highest price currently offered by buyers. If you sell at market, the fill is typically near the bid, depending on liquidity and order size. |
| 23 | Ask | Quote screen, order tickets | The ask is the lowest price currently offered by sellers. If you buy at market, the fill is typically near the ask, depending on available liquidity and the speed of price changes. |
| 24 | Spread | Cost analysis, broker comparisons | The spread is the difference between the bid and ask. It is a direct trading cost that matters most for frequent trading, smaller targets, and less liquid stocks or markets. |
| 25 | Market Order | Fast execution, high urgency trades | A market order is an instruction to buy or sell immediately at the best available price. It prioritizes speed, but the final price can vary in fast markets or when liquidity is thin. |
| 26 | Limit Order | Price control, patient entries | A limit order buys or sells only at a specified price or better. It controls execution price, but it may not fill if the market does not trade at the limit level. |
| 27 | Stop Order | Risk exits, breakout entries | A stop order triggers when price reaches a set level. It is commonly used as a protective exit or as an entry method that activates only if momentum pushes price through a key level. |
| 28 | Stop Loss | Risk control, trade planning | A stop loss is a planned exit that caps losses if price moves against you. It helps protect capital by defining risk in advance and preventing a small loss from turning into a large one. |
| 29 | Slippage | News events, low liquidity trading | Slippage is the difference between the expected price and the actual fill price. It tends to increase during high volatility, low liquidity, and major announcements when prices change faster than orders can fill. |
| 30 | Margin | Leveraged accounts, derivatives trading | Margin is the collateral required to open and maintain leveraged positions. It is not a fee, but if losses reduce equity below required levels, positions can be closed to limit further risk. |
| 31 | Interest Rate | Valuation, bonds, central banks | An interest rate is the cost of borrowing and the return on lending. Interest rates influence bond yields, stock valuations through discounting, and currency demand through yield differences. |
| 32 | Inflation | Macro data, policy expectations | Inflation is a broad rise in prices that reduces purchasing power. Inflation affects company costs and consumer demand, and it strongly influences interest rate expectations and market valuation levels. |
| 33 | Fundamental Analysis | Long term investing, valuation | Fundamental analysis estimates value using earnings, cash flow, balance sheet strength, competition, and economic conditions. It focuses on what a company is worth rather than only how the price has moved. |
| 34 | Technical Analysis | Trading, timing decisions | Technical analysis studies price and volume behavior to plan entries and exits. It uses tools like trend, support and resistance, patterns, and indicators to frame probability and manage risk. |
| 35 | Risk Management | All trading and investing | Risk management is the set of rules that limits losses and stabilizes results. It includes position sizing, stop placement, exposure limits, diversification, and discipline during volatile periods. |
This section covers the stock market terminology used to describe what an investor owns, how they earn returns, and how portfolios are built over time. It includes core ideas such as shares, dividends, capital gains, market capitalization, diversification, and risk, as well as the everyday terms brokers and fund providers use to explain products and account activity.
These basics matter because they shape expectations. If you know how total return is built from price change and distributions, what “cost basis” affects taxes, and why volatility and drawdowns feel different from long-term averages, you can judge performance more accurately and avoid common misunderstandings.
Asset allocation is how you split your money across different asset classes, such as stocks, bonds, cash, and real estate. The goal is to balance risk and return based on your time horizon, goals, and risk tolerance.
Use: Used in portfolio construction, retirement investing, and risk management, often expressed as target percentages.
Example: You invest $10,000 with a 70/30 mix, $7,000 in stocks, and $3,000 in bonds. If stocks fall 20% while bonds rise 5%, the stock portion drops to $5,600, and bonds rise to $3,150, for a total $8,750. The allocation cushions losses versus 100% stocks.
An asset bubble is when the price of something like stocks, real estate, or crypto rises far above its underlying value, mainly because buyers expect to sell later at even higher prices. Bubbles are driven by hype, easy credit, and fear of missing out, and they often end with a sharp drop (a crash) when demand fades or reality catches up.
Use: Discussed in market analysis, risk management, and macroeconomics to warn about overvaluation.
Example: A condo that normally rents for $2,000/month sells for $900,000 because “prices only go up.” If interest rates rise and buyers disappear, it may quickly fall to $650,000, hurting leveraged owners.
An asset class is a group of investments that behave similarly and share common risk and return patterns, like stocks (equities), bonds (fixed income), cash, real estate, or commodities. Investors use asset classes to diversify because different groups often react differently to interest rates, inflation, and economic growth.
Use: Used in diversification, asset allocation, portfolio construction, and risk assessment.
Example: If you hold only tech stocks, your portfolio may drop sharply in a rate-hike cycle. Adding bonds and cash can soften drawdowns because bonds tend to rise when growth slows, while cash preserves capital for rebalancing.
AUD is the ISO currency code for the Australian dollar. In trading and finance, you’ll see AUD in forex pairs (like AUD/USD), commodity-linked market commentary, and Australia-focused assets. AUD often reacts to changes in interest rates, global risk sentiment, and demand for raw materials, as Australia is a major commodities exporter.
Use: Used in forex quotes, international transfers, economic news, and hedging currency exposure.
A blue chip is a large, well-established company with a long track record, strong finances, and a reputation for stability. Blue-chip stocks are usually industry leaders with consistent earnings, durable competitive advantages, and often regular dividends. They tend to be less volatile than smaller companies, but they can still fall during recessions or market crashes, so “blue chip” does not mean risk-free.
Use: Common in long-term investing, dividend portfolios, and defensive equity allocation.
Example: An investor builds a core portfolio of 10 blue-chip stocks and expects steadier returns than those of speculative small caps. If the market drops 15%, a blue chip might fall 10% instead of 30%, helping reduce drawdowns while still participating in long-run growth.
The bond market is where governments and companies borrow money by issuing bonds and where investors buy and sell them. It is also called the fixed-income market. Bond prices and yields move in opposite directions. When yields (interest rates) rise, existing bond prices usually fall, and when yields fall, prices usually rise. The bond market strongly influences mortgage rates, corporate borrowing costs, and overall financial conditions.
Use: Used for income investing, capital preservation, interest-rate views, and macroeconomic signals like yield curves.
Example: You buy a $1,000 bond paying 4% ($40/year). If new bonds start paying 5%, your 4% bond becomes less attractive, so its market price may drop (for example, to about $925) to match the higher yield.
A bull market is a sustained period in which prices trend upward, usually by 20% or more above a prior low, driven by improving earnings, easier financial conditions, or positive investor sentiment. Bull markets often feature rising participation, stronger risk appetite, and higher valuations, but they still include pullbacks and corrections.
Use: Used in market cycles, portfolio strategy, and sentiment analysis, often contrasted with bear markets.
Example: An index bottoms at 3,000 and climbs to 3,600, that is a 20% gain (600 ÷ 3,000). If the index keeps making higher highs over months, investors may call it a bull market. A 5% to 10% drop during that run is a normal correction, not necessarily the end.
Bullish means expecting prices to rise. A bullish trader or investor believes an asset, sector, or the overall market is likely to move higher, based on fundamentals, technical signals, or improving sentiment. Being bullish can be expressed by buying the asset, holding a long position, using call options, or reducing hedges. Bullish does not mean guaranteed gains; it is a directional view that should be paired with risk limits.
Use: Used in market commentary, trade ideas, and position descriptions (bullish bias, bullish setup).
Example: If a stock trades at $40 and you think earnings will beat estimates, you might buy shares at $40 with a stop at $37 and a target at $48. If the price reaches $48, you gain $8 per share. If it drops to $37, you exit to cap the loss.
Cable is the trading nickname for the GBP/USD currency pair, the exchange rate between the British pound (GBP) and the US dollar (USD). It tells you how many USD you need to buy 1 GBP. The term comes from the historic transatlantic cable used to transmit GBP/USD quotes between London and New York.
Use: Used in forex trading, macro analysis, and hedging GBP or USD exposure.
Example: If the cable rises from 1.2500 to 1.2650, GBP strengthened by 150 pips. A 100,000 GBP long position gains about $1,500 (150 pips × $10 per pip).
A capital gain is the profit you make when you sell an asset for more than you paid for it. It can be realized (you sold and locked it in) or unrealized (the price is higher, but you still hold). Capital gains are often taxed differently from regular income, and rules vary by country and holding period, so the after-tax return can matter as much as the market return.
Use: Used in investing, tax planning, performance reporting, and portfolio rebalancing.
Example: You buy 200 shares at $15 and later sell at $22. Your capital gain is ($22 − $15) × 200 = $1,400, before fees and taxes. If you instead sell at $13, that is a capital loss of $400.
Capital preservation is an investing goal focused on protecting your original money (principal) and avoiding large losses, even if it means accepting lower returns. It prioritizes stability, liquidity, and risk control over growth.
Use: Used in retirement planning, near-term goals (1 to 3 years), and conservative portfolio construction during uncertain markets.
Example: You have $50,000 for a home down payment in 12 months. Instead of volatile stocks, you keep 70% in Treasury bills and 30% in a short-term bond fund. If stocks drop 20% in a correction, your portfolio might fall only about 2% to 4%, helping ensure the cash is there when needed.
Commodities are basic raw materials bought and sold, often with standardized quality, so that one unit is broadly interchangeable with another. Common commodities include crude oil, gold, copper, wheat, and natural gas. Their prices are mostly driven by global supply and demand, weather, geopolitics, and economic growth, making them more volatile than many stocks.
Use: Trading, investing, inflation hedging, and risk management through futures, options, ETFs, or physical markets.
Counter currency is the second currency in a forex (FX) currency pair, also called the quote currency. It is the currency used to quote the price of 1 unit of the base currency. In most retail FX platforms, profit and loss are naturally expressed in the counter currency unless converted to your account currency. Understanding base currency vs counter currency helps you read exchange rates correctly.
Use: Quoting and trading currency pairs, calculating position value, and interpreting FX rates.
Example: In EUR/USD = 1.10, EUR is the base currency, and USD is the counter currency. The rate means €1 costs $1.10. If EUR/USD rises to 1.12, the move is +$0.02 per €1, so gains are in USD terms.
Crude oil (WTI and Brent) refers to two main global benchmark grades used to price oil. WTI (West Texas Intermediate) is a US benchmark, priced at Cushing, Oklahoma, and is generally light and low-sulfur. Brent is a North Sea benchmark, widely used for international waterborne crude pricing. Their prices often differ due to regional supply, transport constraints, and demand conditions, creating a WTI-Brent spread.
Use: Energy trading, inflation analysis, oil-linked stocks, and hedging fuel costs with futures and options.
Example: If Brent trades at $85 and WTI at $80, the spread is $5. A widening spread can signal tighter non-US supply or US bottlenecks, affecting refiners and energy ETFs differently.
Currency is a country or region’s official money used to price goods, pay debts, and store value, such as USD, EUR, GBP, and JPY. In trading, currency also refers to forex (FX), where you exchange one currency for another and profit or lose from changes in exchange rates. Currency values move in response to interest rates, inflation, economic growth, trade flows, and risk sentiment.
Use: Forex trading, international investing, paying for imports, hedging exchange-rate risk, and setting portfolio exposure.
Example: If EUR/USD is 1.10, €1 costs $1.10. If EUR/USD drops to 1.05 over a week, the euro will weaken versus the dollar, meaning European buyers get fewer USD per euro, and USD-priced imports become costlier for them.
A currency basket is a weighted group of different currencies used to measure value, set an exchange rate reference, or reduce dependence on any single currency. Each currency has a percentage weight, often based on trade flows, financial importance, or policy goals. Baskets are used to create currency indexes and to manage pegged or managed exchange rates.
Use: FX indexes (like USD indexes), central bank reserve management, and exchange-rate policy for countries that track multiple trading partners.
Example: A basket might be 50% USD, 30% EUR, 20% JPY. If USD rises 4%, EUR falls 1%, and JPY is flat, the basket change is about +1.7% (0.50×4% + 0.30×-1% + 0.20×0%).
Currency exposure is how much your portfolio’s value can change because of exchange rate moves. You can have direct exposure by holding foreign cash or FX trades, and indirect exposure by owning overseas stocks, bonds, or commodities priced in another currency.
Use: International investing, portfolio risk management, hedging decisions (hedged vs unhedged ETFs), and performance attribution.
Example: You buy a US stock for $10,000 when USD/JPY is 150. If the stock stays flat but USD/JPY falls to 140, converting back gives ¥1,400,000 instead of ¥1,500,000, a 6.7% FX loss.
A currency pair is the quotation of one currency against another in forex trading, showing how much of the quote currency you need to buy 1 unit of the base currency. In EUR/USD, EUR is the base currency, and USD is the quote currency. If EUR/USD is 1.1000, €1 costs $1.10. Pairs move because traders continually reassess interest rates, inflation, growth, and risk sentiment across the two economies.
Use: Forex trading, international hedging, and pricing cross-border transactions.
Example: You buy 10,000 EUR at 1.1000, costing $11,000. If EUR/USD rises to 1.1200, selling for $11,200 yields a $200 profit before fees.
Currency risk (foreign exchange risk) is the chance that exchange-rate moves change the value of an investment, cash flow, or profit when converted into your home currency. It affects investors holding foreign assets, companies with overseas revenue or costs, and anyone with foreign-currency debt. Currency risk can be reduced by hedging (forwards, futures, options), matching revenues and costs in the same currency, or using currency-hedged funds.
Use: International portfolios, corporate treasury, import-export pricing, and FX hedging decisions.
Example: You invest €20,000 in a European ETF when EUR/USD is 1.10, which is equivalent to $22,000. If the ETF stays flat but EUR/USD falls to 1.00, your holding becomes $20,000, a $2,000 loss purely from FX movement.
Currency strength is how much a currency is rising or falling relative to other currencies, often measured against a basket rather than a single pair. A stronger currency buys more foreign currency, which can lower import prices but hurt exporters by making their goods more expensive abroad. Strength is influenced by interest rate differentials, inflation, economic growth, trade balance, and market risk sentiment.
Use: Forex analysis, macro trading, export and import impact, and central bank policy monitoring.
Example: If USD strengthens, EUR/USD might fall from 1.10 to 1.05, meaning €1 now buys fewer dollars. For a US tourist, Europe becomes cheaper in USD terms, but a European company paying USD for oil faces higher costs per euro.
A dividend is a cash payment (or sometimes extra shares) that a company distributes to shareholders, usually from profits or retained earnings. Dividends are typically quoted as a dividend per share and as a dividend yield (annual dividend divided by share price). A dividend is not guaranteed; the company can raise, cut, or suspend it.
Use: Income investing, valuing mature companies, total return analysis, dividend growth strategies.
Example: A stock trades at $50 and pays $2.00 in dividends per year, so the dividend yield is 4%. If the price rises to $60 but the dividend stays $2.00, the yield falls to 3.33%. If the company cuts the dividend to $1.00, income drops, and the stock may sell off.
Dollar-cost averaging (DCA) is an investing method in which you invest a fixed amount at regular intervals, regardless of price. This spreads your entry over time, reducing the risk of investing all your money right before a drop. It does not guarantee profits or prevent losses, but it can lower the average purchase price during volatile or declining markets and help build a consistent investing habit.
Use: Long-term investing in ETFs, index funds, and retirement plans, especially in volatile markets.
Example: You invest $500 per month in an ETF. Month 1: $50 (10 shares); month 2: $40 (12.5 shares); month 3: $45 (11.11 shares). You buy more shares when the price is lower, so your average cost per share ends up below $50 even without timing the market.
Equity is ownership value. For a company, equity represents the value of shareholders' interests after subtracting total liabilities from total assets; it is often called shareholders’ equity or book value. In markets, “equity” also refers to stocks, which are shares of ownership in a business. Equity can rise when the business earns profits or when the stock price increases, but it can fall with losses or dilution from issuing more shares.
Use: Company balance sheets, stock investing, and portfolio allocation (equities vs bonds).
Example: A firm has $500M in assets and $320M in liabilities, so equity is $180M. If it issues $20M of new shares, equity rises, but existing shareholders may be diluted if profits do not grow enough to justify the larger share count.
An equity market is where companies' shares (equities or stocks) are issued, bought, and sold. It includes primary markets (new shares sold in IPOs or secondary offerings) and secondary markets (investors trading existing shares on exchanges like NYSE or Nasdaq). Equity markets help companies raise capital for growth, and they let investors earn returns through price appreciation and dividends, but prices can be volatile.
Use: Stock investing, raising corporate funding, index tracking (S&P 500), and measuring risk sentiment.
Example: A company lists 100M shares at $20 in an IPO, raising $2B in the primary market. Later, investors trade those shares between $18 and $30 in the secondary market, setting the firm’s market value day to day.
An ETF (exchange-traded fund) is an investment fund that holds a basket of assets, like stocks, bonds, or commodities, and trades on an exchange like a stock. Most ETFs track an index and aim to mirror its performance, minus fees (expense ratio). ETFs are popular because they offer diversification, transparency of holdings, and easy buying and selling during market hours.
Use: Portfolio building, index investing, sector or theme exposure, and low-cost diversification.
Example: You buy $5,000 of an S&P 500 ETF with a 0.05% expense ratio. If the index rises 10% in a year, your ETF might return about 9.95% before taxes, and you can sell it anytime during the trading day.
An exchange rate is the price of one currency in terms of another, showing how much of the quote currency you need to get 1 unit of the base currency. For example, EUR/USD 1.10 means €1 costs $1.10. Exchange rates move with interest rate expectations, inflation differences, trade flows, and risk sentiment, and they can change quickly in response to news.
Use: Forex trading, international investing, travel and remittances, import and export pricing.
Example: If USD/SGD is 1.34, $1 buys S$1.34. If it rises to 1.38, the USD strengthens and the SGD weakens, so USD-priced goods become more expensive for someone paying in SGD, while a Singapore exporter selling to the US may earn more SGD per $1 of revenue.
Forex (foreign exchange) is the global market where currencies are bought and sold, typically in pairs such as EUR/USD or USD/JPY. It is the largest financial market and is mostly over-the-counter (OTC), meaning trades happen through banks, brokers, and electronic networks rather than a single exchange. Prices move based on interest rates, inflation, economic data, and risk sentiment, and leverage can amplify gains and losses.
Use: Currency trading, hedging FX risk for international business, and macro investing.
Example: If you buy EUR/USD at 1.1000 and it rises to 1.1100, that is a 100-pip move. On a 100,000 EUR position, the gain is about $1,000 before fees, but the same move against you can lose $1,000.
GBP is the ISO currency code for the British pound sterling, the official currency of the United Kingdom. Its symbol is £, and it is one of the most traded currencies in the forex market. GBP’s value moves with UK inflation, interest rate expectations from the Bank of England, economic data, and global risk sentiment.
Use: Forex pairs like GBP/USD, pricing UK stocks and bonds, and managing FX risk for UK trade and travel.
Example: If GBP/USD is 1.2800, £1 costs $1.28. If it rises to 1.3200, GBP strengthened versus USD, meaning UK imports priced in USD become cheaper in £ terms.
Gold is a precious metal that is traded as a commodity and held as a store of value. In markets, gold is often viewed as a hedge against inflation, currency weakness, and financial stress, although it can still be volatile. Its price is strongly influenced by real interest rates, USD strength, central bank buying, and risk sentiment. Gold is commonly quoted in USD per troy ounce (XAU/USD).
Use: Safe-haven positioning, portfolio diversification, inflation hedging, and commodity trading.
Example: If XAU/USD is $2,000 and real yields rise, gold may fall because holding non-yielding gold becomes less attractive. A move down to $1,920 represents a 4% drop and could offset gains in risk assets during calmer markets.
An index is a calculated benchmark that tracks the performance of a group of assets, like stocks, bonds, or commodities, to represent a market or sector. It is not usually something you buy directly, but you can invest in it through index funds, ETFs, or futures. Index construction matters; it may be weighted by market cap (S&P 500) or price (Dow), which changes how big companies influence moves.
Use: Measuring market performance, benchmarking portfolios, and trading broad market exposure.
Example: If the S&P 500 rises from 4,500 to 4,725, the index is up 5%. An S&P 500 ETF may also gain about 5% minus fees. If the index is market-cap weighted, a few mega-cap stocks can drive most of that move even if many smaller stocks are flat.
An inflation hedge is an investment or strategy intended to protect purchasing power when prices rise. The idea is to hold assets that may keep up with, or benefit from, higher inflation, although no hedge is perfect. Common inflation hedges include inflation-linked bonds (like TIPS), commodities, real assets such as real estate, and some equities with strong pricing power. The best choice depends on time horizon, interest rates, and your currency exposure.
Use: Portfolio construction, protecting long-term savings, and managing real (inflation-adjusted) returns.
Example: If inflation jumps to 6% and a nominal bond yields 3%, the real return is about -3%. Holding TIPS can help because their principal adjusts with inflation. A small allocation to broad commodities may also rise when energy and food prices surge, partly offsetting the loss of purchasing power elsewhere.
An IPO (Initial Public Offering) is when a private company sells shares to the public for the first time and becomes listed on a stock exchange. The company raises capital, early investors may sell some holdings, and the market sets a public price through trading after the launch. IPO stocks can be volatile because price discovery is new, share supply can change after lockups, and valuations may be uncertain.
Use: Equity markets, company fundraising, growth investing, and new listing research.
Example: A company prices its IPO at $20 and lists 50M shares, implying a market value of $1B. If it opens at $28, early buyers made 40% on day one, but it can also drop below $20 if demand fades. After a 180-day lockup period ends, additional shares may hit the market, putting pressure on the price.
The Japanese yen (JPY) is the official currency of Japan, symbolized by ¥, and one of the most traded currencies in the forex market. It is often seen as a “safe-haven” currency, meaning it can strengthen when global investors reduce risk, and it is also widely used in carry trades because Japan has often had relatively low interest rates. JPY pairs are typically quoted to two decimal places, for example, USD/JPY.
Use: Forex trading (USD/JPY, EUR/JPY), macro analysis, Bank of Japan policy, carry trade discussions.
Example: If USD/JPY falls from 150.00 to 145.00, the yen strengthened versus the dollar. For a Japanese investor holding USD assets, this can reduce returns when converting back into JPY.
Loonie is the nickname for the Canadian dollar (currency code: CAD). The name comes from the loon bird shown on Canada’s $1 coin. In forex, traders often call CAD “the loonie,” especially when discussing USD/CAD. CAD tends to be sensitive to oil prices and broader commodity demand because Canada is a major commodity exporter, and it also reacts to Bank of Canada interest rate expectations.
Use: Forex commentary, commodity-linked currency analysis, and trading pairs like USD/CAD and CAD/JPY.
Example: If oil rallies and USD/CAD falls from 1.3600 to 1.3300, CAD strengthened. That means it takes fewer CAD to buy $1, which can lower CAD costs for USD-priced imports.
The New Zealand dollar (NZD) is the official currency of New Zealand, with the code NZD and often nicknamed the “kiwi.” NZD is widely traded in forex pairs like NZD/USD and AUD/NZD. It tends to be sensitive to global risk sentiment, interest rate expectations from the Reserve Bank of New Zealand (RBNZ), and commodity and dairy export demand, as New Zealand is an export-focused economy.
Use: Forex trading, carry trade discussions, and analyzing Asia-Pacific macro and commodity-linked currencies.
Example: If NZD/USD rises from 0.6000 to 0.6300, NZD strengthened versus USD. A New Zealand exporter paid in USD receives fewer NZD per $1, which can hurt revenue in NZD terms unless it hedges with forwards.
A portfolio is the collection of investments you own, such as stocks, bonds, ETFs, cash, and alternatives. Portfolio management is about choosing asset allocation, position sizes, and risk controls so that your overall exposure aligns with your goals, time horizon, and risk tolerance.
Use: Long-term investing, retirement planning, performance tracking, and risk management.
Example: A simple portfolio might be 70% global stock ETFs and 30% bond ETFs. If you have $100,000, that is $70,000 in equities and $30,000 in bonds. If stocks drop 10% and bonds rise 2%, the portfolio return is about -6.4%: (0.70 × -10%) + (0.30 × 2%). Rebalancing can restore the target weights after big moves.
The quote currency is the second currency in a forex pair and indicates which currency the exchange rate is priced in. It shows how many units of the quote currency are needed to buy 1 unit of the base currency. In EUR/USD, USD is the quote currency. If EUR/USD is 1.1000, it means €1 costs $1.10.
Use: Reading forex quotes, calculating profit and loss, understanding pip value, and setting trade direction.
Example: In GBP/JPY at 185.50, JPY is the quote currency, so £1 costs ¥185.50. If GBP/JPY rises to 187.00, the pair moves +150 pips (because JPY pairs use 0.01 per pip). A trader longs GBP/JPY profits because the quote currency (JPY) is weakening versus the base (GBP).
A safe haven is an asset or currency that investors tend to move into when markets feel risky, aiming to preserve value during uncertainty. Safe havens are not “risk-free,” but they often hold up better when stocks drop or volatility rises. Common examples mentioned in markets include USD, CHF, JPY, gold, and US Treasury bonds, depending on the situation.
Use: Market news, risk-off sentiment, crisis periods, and forex or portfolio hedging discussions.
Example: If global stocks fall 3% in a day, traders may buy CHF and JPY and sell riskier currencies. If USD/CHF drops from 0.9200 to 0.9100, CHF strengthens as a safe-haven flow.
The spot market is where you buy or sell something at the current price, for delivery as soon as the market normally settles. It is basically “pay the price you see now,” not a contract for a future date. The exact delivery timing depends on the market, but it is usually sooner than futures.
Use: Used in forex (spot FX), crypto exchanges, and commodities when traders want today’s price, not next month’s price.
Example: If BTC is $40,000 on a crypto exchange and you buy 0.1 BTC, you pay about $4,000 in fees and own it right away on the platform. If the EUR/USD spot is 1.1000, buying €1,000 costs about $1,100 (ignoring fees).
Spot price is the current market price to buy or sell an asset right now (at today’s price), for near-immediate settlement based on that market’s normal timing. It is the “cash” price you see quoted, not a futures price for delivery later.
Use: Quoted constantly in forex (spot FX), commodities like gold or oil, and crypto, and used as a reference for pricing futures and options.
Example: If gold spot is $2,050 per oz, that is the price for gold today. If a 3-month gold futures contract is trading at $2,080, the $30 difference reflects financing and storage costs, as well as market expectations.
Swissy is a trader's nickname for the Swiss franc, CHF. In forex, you’ll see it in currency pairs like USD/CHF (US dollar vs Swiss franc) and EUR/CHF. The Swiss franc is often seen as a “safe-haven” currency, meaning it may strengthen when investors feel nervous and move money into safer places, although this is not guaranteed.
Use: Forex trading slang, market commentary, and pair names involving CHF.
Example: If USD/CHF drops from 0.9200 to 0.9100, it means CHF strengthened, and USD weakened versus CHF. A trader who was short USD/CHF would profit from that move (before spread and fees).
USD is the ISO currency code for the United States dollar, the official currency of the United States. In global markets, USD is the most widely used trading and pricing currency, often referred to as the world’s main reserve currency. Many commodities (like oil and gold) are commonly quoted in USD, and many forex pairs are built around USD.
Use: Forex quotes (EUR/USD, USD/JPY), commodity pricing, international trade, and financial news.
Example: If EUR/USD is 1.1000, €1,000 costs about $1,100 (ignoring spread and fees). If the pair rises to 1.1200, the euro will strengthen versus the USD.
WTI (West Texas Intermediate) is a benchmark grade of US crude oil, often called “light, sweet” because it has relatively low sulfur and flows easily. Traders use WTI as a reference price for US oil, and it is the main crude contract traded on NYMEX (CME) in oil futures.
Use: Energy market news, oil futures trading, inflation and macro analysis, and comparing US oil pricing versus Brent.
Example: If WTI is $75 per barrel and Brent is $78, the $3 gap is the Brent-WTI spread. A US refinery or trader might hedge costs using WTI futures if their exposure is tied to US crude prices.
Yield is the return you earn from an investment, usually shown as a % per year. It often refers to income you receive, such as bond interest or stock dividends, relative to the current price you pay. Yield changes when price changes, even if the income stays the same.
Use: Common in bonds (yield to maturity, current yield), dividend stocks (dividend yield), and savings products (interest yield).
Example: A stock pays a $2 yearly dividend. If the stock price is $50, the dividend yield is 4% ($2 ÷ $50). If the price drops to $40 and the dividend stays $2, the yield rises to 5%, even though the dividend did not change.
Trading execution terminology explains how an order becomes a trade and why the fill price is not always the last quoted price. It covers order types, time-in-force instructions, bid-ask spread, slippage, liquidity, and how different market conditions affect execution speed and cost.
Understanding these terms helps traders control outcomes they can actually influence: entry price, exit discipline, and transaction costs. It also clarifies why the same strategy can perform differently across brokers, sessions, or products when spreads widen, depth thins, or volatility rises.
The account balance is the current amount of money in your trading account, as shown after all completed transactions have been applied. It reflects settled cash flows: deposits, withdrawals, trading profits and losses, interest, and fees. The account balance does not include the real-time profit or loss on open positions, so it may differ from the equity (which fluctuates with market prices).
Use: Portfolio tools, account summary, trading platform dashboard, statements, risk, and margin screens.
Example: You deposit $2,000 and make $150 profit on a closed trade, then pay $10 in fees. Your account balance becomes $2,140.
An active order is a trade instruction you have placed that is currently working in the market but has not been fully filled or canceled. It can be a limit order, stop order, stop-limit order, or take-profit/stop-loss order attached to a position. Active orders may be “pending” (waiting for price) or “partially filled” (only some shares/contracts executed).
Use: Orders tab, order ticket, open orders list, advanced order settings, position management panels.
Example: You place a buy limit at $50 while the stock trades at $52. Until price hits $50 or you cancel it, that buy limit is an active order.
An All or None (AON) order is a buy or sell order that must be filled completely in one execution, or not filled at all. It prevents partial fills, so you avoid receiving only some shares and paying multiple spreads or commissions.
Use: Advanced order settings, stock, and options trading when exact position size matters.
Example: You place an AON buy for 1,000 shares at $10.00. If only 400 shares are available at $10.00, nothing fills. The order executes only when the market can deliver all 1,000 shares at $10.00 or better in a single fill.
The ask-bid spread (bid-ask spread) is the gap between the highest price buyers are willing to pay (bid) and the lowest price sellers are willing to accept (ask). It is a basic measure of liquidity and trading cost; a tighter spread usually means easier, cheaper trading, while a wider spread often signals lower liquidity or higher uncertainty.
Use: Quoted on stock, forex, and crypto order books, used to estimate transaction costs and market liquidity.
Example: A stock shows a bid $50.00 and an ask $50.08. The spread is $0.08. If you buy at $50.08 and immediately sell at $50.00, you lose $0.08 per share (before fees).
The ask price (or offer price) is the lowest price a seller is willing to accept for a security at this time. It’s quoted alongside the bid price (what buyers will pay). The gap between them is the bid-ask spread, which reflects liquidity and trading costs. If you place a market buy order, you typically pay the current ask price; with a limit buy, you set the maximum you’re willing to pay.
Use: Stock quotes, forex quotes, options chains, and order books when placing buy orders.
Example: A stock shows a bid $49.95 and an ask $50.05. A market buy is likely to fill near $50.05. The $0.10 spread is an immediate cost you “pay” for quick execution.
Bid is the highest price a buyer is currently willing to pay for an asset in the market. If you place a market sell order, you usually sell at the bid. The bid matters because it reflects immediate demand and is one side of the bid-ask spread, which affects your trading cost and how quickly you can exit a position.
Use: Shown in quotes and order books for stocks, forex, options, and crypto, used to estimate execution price.
Example: A stock is quoted at a bid of $25.40 and an ask of $25.45. If you sell 200 shares at market, you’ll likely get about $25.40 per share. The $0.05 spread means buying and selling immediately loses $0.05 per share (before fees).
Bid-ask spread is the difference between the bid price (the highest buy offer) and the ask price (the lowest sell offer). It is a key trading cost and a quick liquidity signal: tighter spreads usually mean more active trading and easier execution, while wider spreads often indicate thin volume or greater uncertainty. You effectively “pay the spread” when you buy at the ask or sell at the bid.
Use: Used in order books, quote screens, market making, and slippage and transaction-cost analysis.
Example: Quote: bid $100.00, ask $100.20. The spread is $0.20 (0.20%). If you buy 50 shares at $100.20 and immediately sell at $100.00, you lose $10 (50 × $0.20), before commissions.
A block trade is a single, large buy or sell order, typically executed privately or through a broker to reduce market impact. Because large orders can move prices, block trades are often handled via negotiated pricing, dark pools, or staged execution to limit slippage and avoid signaling to other traders. The trade may print on the tape after execution, which can sometimes cause a short-term price reaction.
Use: Common in institutional trading, rebalancing, and insider or fund flows, often reported as “block” or “off-exchange” volume.
Example: A fund wants to sell 500,000 shares of a $20 stock ($10,000,000). Dumping it into the open market could push down bids. Instead, a broker finds buyers and crosses it at $19.95, saving $0.10 per share versus heavy slippage.
Break-even point is the price or outcome at which you neither make a profit nor a loss after all costs. In trading, it usually means the level your position must reach to cover the entry price, plus trading fees, spreads, and any financing costs. For options, break-even is the strike price adjusted by the premium paid or received.
Use: Used to plan trade targets, set stop-loss levels, and evaluate whether a setup offers enough reward versus risk.
Example: You buy 100 shares at $50.00 and pay a total of $10 in commissions. Your break-even is ($50.00 × 100 + $10) ÷ 100 = $50.10. Above $50.10, you profit; below it, you lose.
Commission is a fee a broker charges for executing a trade. It can be a flat amount per order, a per-share fee, or built into a pricing plan. Even with “zero-commission” trading, you may still pay indirectly through bid-ask spreads, price improvement, or other routing costs.
Use: Used in trading cost analysis, broker comparisons, and calculating break-even levels.
Example: Your broker charges $4.95 per stock trade. If you buy 100 shares and later sell them, the total commission is $9.90. If your target profit is $0.05 per share ($5), commissions alone exceed the expected gain, so the trade is not worth it unless you scale up or improve execution.
Day trading is a trading style where positions are opened and closed within the same trading day, aiming to profit from short-term price moves. It relies on liquid markets, tight spreads, fast execution, and strict risk management because small moves and fees can matter a lot. Day traders often use technical analysis, news catalysts, and order flow, along with predefined entries, stops, and daily loss limits, to avoid large drawdowns.
Use: Active trading in stocks, forex, futures, and crypto on intraday timeframes (1-minute to 1-hour).
Example: You buy 200 shares at $50.20 and set a stop at $49.90 (risk $0.30, or $60). You sell at $50.80 the same day for a $0.60 gain, or $120 before fees, with a 2:1 reward-to-risk ratio.
A demo account is a practice trading account that uses simulated money and real-time or delayed market prices, letting you place trades without risking real funds. It helps you learn order types (market, limit, stop), test a strategy, and get comfortable with a platform’s charts and execution. The main limitation is that fills, slippage, and emotions can differ from live trading, so results may look better than reality.
Use: Beginner training, strategy backtesting, forward testing, platform, and broker evaluation.
Example: You open a demo account with $10,000 and trade EUR/USD, risking 1% per trade ($100). After 50 trades, you are up 4%, but in a live account, spreads and faster moves might turn some “wins” into breakeven or small losses, so treat demo results as a rough guide.
Drawdown is the decline from a peak to a subsequent low in an account, investment, or price, usually expressed as a percentage. It measures how much you are down from your best point, not your starting point. Traders track maximum drawdown because it captures worst-case pain and helps set risk limits, position sizing, and stop-loss rules.
Use: Performance evaluation, risk management, strategy testing, and comparing funds or trading systems.
Example: Your account grows to $50,000, then falls to $42,500 before recovering. The drawdown is $7,500, which is 15% ($7,500 ÷ $50,000). If your plan caps drawdown at 10%, you would need to reduce risk or pause trading once losses reach $45,000.
Equity drawdown is the drop in your account’s equity from its highest point (peak) to a later low (trough), usually shown as a percentage. Equity includes your cash balance plus unrealized profit or loss on open trades, so drawdown reflects real-time risk, not just closed results. It is a key trading risk metric for capital preservation and position sizing.
Use: Used in trading performance reports, risk management rules, and evaluating strategy robustness.
Example: Your account equity peaks at $10,000, then falls to $8,500 during a losing streak. The equity drawdown is $1,500, or 15%. If your max allowed drawdown is 10%, you would reduce risk or stop trading.
ETF liquidity is how easily you can buy or sell an ETF at a fair price without causing a big move. It depends on two layers: the ETF’s on-screen trading (volume and bid-ask spread) and the liquidity of the underlying holdings, because authorized participants can create or redeem shares to keep prices close to net asset value (NAV). Tight spreads usually mean better liquidity.
Use: Choosing ETFs for active trading, estimating trading costs, and planning order types.
Example: ETF A trades with a $0.01 spread on a $100 price (0.01%) and a deep order book, so a $50,000 trade may fill near mid-price. ETF B has a $0.30 spread on $30 (1%), so the same trade can cost far more and slip during volatile markets.
An exit strategy is your planned method for closing a trade or investment, either to take profit or limit loss. It includes specific rules for when to sell, such as a price target, a stop-loss level, a trailing stop, or a time-based exit. A clear exit strategy reduces emotional decisions and helps you keep risk and reward consistent across trades.
Use: Trade planning, risk management, and systematic trading rules for stocks, forex, and crypto.
Example: You buy at $50 with a stop at $48 (risk $2). Your plan is to take profit at $56 (reward $6, a 3:1 ratio) or trail a stop $1 below the 20-day EMA after the price reaches $54. If the price drops to $48 first, you exit automatically and protect capital.
Exposure management is controlling the risk you take in your positions, including size, leverage, concentration, and sensitivity to factors such as a single stock, a sector, USD, or interest rates. It aims to keep losses survivable by setting limits on total portfolio exposure, per-trade risk, and correlated bets. Good exposure management uses position sizing, diversification, and hedging to avoid a single move wiping out your account.
Use: Portfolio risk limits, position sizing, leverage control, sector caps, net and gross exposure, and hedging.
Example: You have a $50,000 account and a cap risk at 1% per trade ($500). If your stop is 2% away, you size the position at $25,000 ($500 ÷ 0.02). You also cap any single sector to 20%, so even 3 “different” tech stocks cannot exceed $10,000 total.
A fill is the execution of your order, meaning the market matched your buy or sell with someone on the other side. The fill price can differ from the price you expected due to spreads, slippage, partial fills, and fast markets. Market orders usually fill quickly but at the best available price, while limit orders control price but may not fill.
Use: Order execution, trade confirmations, measuring slippage, and evaluating broker quality.
Example: You place a market buy for 1,000 shares when the bid is $10.00, and the ask is $10.02. In a fast move, you get filled at $10.05, with $0.03 per-share slippage, or $30 extra cost. A limit buy at $10.02 would avoid paying $10.05, but might not fill if the price keeps rising.
A fractional pip is a smaller unit of a pip in forex quotes, often called a pipette. Most major pairs are quoted to 5 decimal places, where 1 pip is 0.0001 and 1 fractional pip is 0.00001 (one-tenth of a pip). For JPY pairs, 1 pip is 0.01, and a fractional pip is 0.001.
Use: More precise pricing, tighter spreads, and measuring small execution differences (slippage).
Example: EUR/USD moves from 1.10500 to 1.10523, that is 2.3 pips (23 fractional pips). If your spread is 0.8 pips, it might be shown as 8 fractional pips.
Good for Day (GFD) is a time-in-force order that stays active only for the current trading day. If it is not filled by the market’s close, the broker automatically cancels it. GFD is common for limit and stop orders when you only want the setup to work today and do not want overnight exposure or surprise fills the next session.
Use: Day trading orders, short-term limit entries, intraday stop orders, and managing overnight risk.
Example: At 10:00 a.m., you place a GFD limit buy at $49.50 on a stock trading at $50.20. Price never drops to $49.50, and the market closes at 4:00 p.m. Your order is canceled, so it cannot be filled tomorrow if the stock gaps down.
Good Till Cancelled (GTC) is a time-in-force order that remains active until it is filled or you cancel it manually. Unlike Good for Day (GFD), it can stay open across multiple trading sessions, sometimes for weeks or months, depending on the broker’s maximum duration. GTC is useful for long-term limit entries or take-profit orders, but it can fill unexpectedly after news or a gap.
Use: Swing and position trading, setting long-lasting limit buys, profit targets, and stop orders.
Example: A stock trades at $60, and you place a GTC limit buy at $52. Two weeks later, weak earnings cause a gap down to $51 at the open, and your order fills near $52 (or better). If you forgot the order, you might end up in a position you did not plan for, so monitoring is important.
Illiquidity is when an asset is hard to buy or sell quickly at a fair price because there are not enough buyers and sellers. Illiquid markets often have wider bid-ask spreads, smaller order book depth, and more slippage, so trades can move the price against you. Illiquidity risk increases during market stress, around news events, and in small-cap stocks and thinly traded crypto.
Use: Trading cost analysis, choosing position size, setting limit orders, and risk management.
Example: A stock shows a $10.00 bid and a $10.30 ask, with only 500 shares available at each level. If you market buy 5,000 shares, you may get filled across many higher prices, averaging $10.60. That extra cost is slippage caused by illiquidity.
A limit entry is an order to enter a trade only at a specified price or better. A buy limit is placed below the current market price, and it fills at your limit price or lower. A sell limit is placed above the current price, filling at your limit price or higher. Limit entries give price control and can reduce slippage, but they may not fill if the market never reaches your level.
Use: Pullback buying, selling into rallies, reducing spreads and slippage, and planning trades at support or resistance.
Example: A stock trades at $100, and you want to buy at support near $96. You place a buy limit at $96 with a stop at $94. If the price dips to $95.90, you may fill around $95.90. If it never drops to $96 and instead rallies to $110, you miss the trade, which is the tradeoff for price control.
A limit order is an order to buy or sell at a specific price or better. A buy limit executes at your limit price or lower, and a sell limit executes at your limit price or higher. It gives you price control, which can reduce slippage, but it does not guarantee a fill if the market never reaches your price or if liquidity is thin.
Use: Entering at support or resistance, setting take-profit targets, and trading illiquid markets more safely than with market orders.
Example: A stock is $50.20. You place a buy limit at $49.80. If price drops and sellers are available, you may fill at $49.80 (or better). If the stock only falls to $49.85 and rebounds, you get no fill. To take profit, you might place a sell limit at $54.00 and wait for the price to hit it.
Liquidation is the forced closing of your position because you no longer have enough margin to support the trade, usually after losses reduce your account equity. Brokers or exchanges liquidate positions to prevent your balance from going negative, especially in leveraged products like forex, futures, and crypto-perpetuals. “Liquidation” can also mean selling assets quickly, but in trading, it usually refers to a margin-driven closeout.
Use: Margin trading, leverage control, understanding margin calls, and stop-out levels.
Example: You have $1,000 and open a $10,000 position (10x). If the price moves against you by 8% ($800 loss), your equity drops sharply, and your margin level may hit the broker’s liquidation threshold. The platform closes your trade at the market price, potentially with additional slippage during fast moves.
A live trading account is a real-money brokerage account where your orders execute in the actual market, so profits and losses are real. Compared with a demo account, live trading includes real spreads, commissions, slippage, partial fills, and the psychological pressure of risking capital. Brokers may require identity verification, margin approval, and minimum deposits, and your account is subject to margin calls and liquidation rules if you use leverage.
Use: Executing real trades in stocks, forex, futures, or crypto, and tracking real performance.
Example: You fund a live account with $5,000 and risk 1% ($50) per trade. You buy 50 shares at $40 with a stop at $39. If a fast drop gaps to $38.70, your stop may fill near $38.70, losing about $65 instead of $50, showing real slippage risk.
A long position means you bought an asset expecting its price to rise. You profit if the price goes up and lose if it goes down. In stocks, going long usually means owning shares. In futures, forex, or CFDs, a long position means you are exposed to upward price moves, often with leverage and margin, which increases both risk and potential return.
Use: Bullish trades, portfolio investing, and expressing positive views on a stock, index, commodity, or currency pair.
Example: You buy 100 shares at $50, so you are long $5,000. If the price rises to $56, your profit is $600. If it falls to $47, your loss is $300. With leveraged products, the same move can create a much larger percentage gain or loss on your account equity.
A lot is a standardized trading size used in forex (and some CFDs) to describe how much currency you are buying or selling. In spot forex, 1 standard lot is typically 100,000 units of the base currency, 1 mini lot is 10,000 units, and 1 micro lot is 1,000 units. Lot size matters because it directly sets your pip value and risk per trade.
Use: Forex position sizing, calculating pip value, margin requirements, and risk management.
Example: In EUR/USD, a 1 standard lot position (100,000 EUR) is roughly $10 per pip. A 0.10 lot (mini) is about $1 per pip, and a 0.01 lot (micro) is about $0.10 per pip. If you risk 30 pips, a 1.00 lot risks about $300, while a 0.10 lot risks about $30 (before spreads).
A market order is an instruction to buy or sell at the best available price, immediately. It prioritizes getting filled over getting a specific price, so the final fill can be worse than expected in fast markets due to spreads, slippage, or partial fills. Market orders work best for highly liquid assets, but they can be risky around news or at the open, when prices can gap.
Use: Fast entry or exit, closing positions quickly, and trading liquid markets.
Example: A stock shows $100.00 bid and $100.05 ask. You place a market buy for 500 shares and get filled at $100.06 because the best ask was taken before your order arrived. Your immediate cost is the spread plus $0.01 slippage. In a thin stock, the same order might fill across multiple prices, averaging much higher.
Money management is the set of rules you use to control risk and protect capital when trading or investing. It covers position sizing, risk per trade, leverage limits, diversification, and drawdown controls. Good money management matters because even a strong strategy can fail if losses get too large or if you overtrade. Common rules include risking 0.5% to 2% per trade and setting a maximum daily or weekly loss limit.
Use: Trading plans, risk management, and performance consistency across forex, stocks, and crypto.
Example: You have $20,000 and risk 1% per trade ($200). If your stop is $2 away, you buy 100 shares ($200 ÷ $2). If you hit a -3% weekly drawdown ($600), you pause trading or cut risk in half. That keeps a losing streak from becoming account-ending.
An OCO (One Cancels Other) order links two orders so that when one is filled, the other is automatically canceled. Traders use OCO to manage “either-or” outcomes, like a take-profit and a stop-loss, or a breakout buy above resistance and a breakdown sell below support. OCO helps automate risk control and prevent duplicate fills.
Use: Bracket orders, breakout trading, risk management, and managing trades when you cannot watch the market.
Example: A stock trades at $100. You set an OCO with a take-profit sell at $108 and a stop-loss sell at $96. If price hits $108 first, you exit with profit, and the $96 stop is canceled. If it drops to $96 first, the stop executes, and the $108 order is canceled to avoid a conflict with open orders.
An open position is a trade you have entered but not yet closed, so you still have market exposure. Its value changes with price movements, creating unrealized profit or loss (floating P&L). Open positions also tie up margin in leveraged accounts and can be affected by overnight costs, such as swaps or financing. You realize the profit or loss only when you close the position.
Use: Monitoring risk, calculating margin and free margin, managing exposure, and tracking floating P&L.
Example: You buy 100 shares at $50, and the price is now $53. Your position is open with a $300 unrealized gain. If the price drops to $48, the same open position shows an unrealized loss of $200. If you close at $53, the $300 becomes realized profit (before fees).
An order book is the live list of buy and sell orders for an asset, organized by price level. It shows bids (buyers) and asks (sellers) with their quantities, helping you see market depth and where liquidity sits. The best bid and best ask form the bid-ask spread, and changes in the order book can signal short-term supply and demand.
Use: Day trading, scalping, judging liquidity, planning limit orders, and spotting support or resistance levels.
Example: If the best bid is $99.98 for 2,000 shares and the best ask is $100.00 for 1,500 shares, the spread is $0.02. If you market buy 5,000 shares, you may “walk the book” and fill at $100.00, $100.02, and $100.05, creating slippage.
A partial fill occurs when only part of your order is executed, and the remaining quantity remains open until more liquidity becomes available, the order expires, or it is canceled. It is common with illiquid assets, large orders, or limit orders at a specific price. Partial fills can change your average entry price and make risk management trickier if you expected a full position.
Use: Order execution, trading thin stocks or crypto, limit orders, and managing slippage.
Example: You place a limit buy for 5,000 shares at $10.00. Only 1,800 shares are available at $10.00, so you get a partial fill for 1,800, and 3,200 shares remain pending. If the price moves up, the rest may never fill, leaving you with a smaller position than planned. Adjust your stop-loss risk and profit targets to the filled size.
A pending order is an order you place that has not executed yet and will only trigger if the price reaches your specified level. Common pending orders include limit orders (buy below, sell above) and stop orders (buy above, sell below). Pending orders help you plan trades in advance, but they can fill during sudden spikes or gaps, sometimes with slippage, especially around news.
Use: Setting entries at support or resistance, breakout trading, automating trade plans, and managing time-in-force (GTC, GFD).
Example: A stock trades at $100. You set a buy stop at $102 to enter only if it breaks resistance, and a stop-loss at $99. If price jumps on news and opens at $104, your pending buy stop may fill near $104, not $102, increasing your risk unless you resize or cancel during the gap.
A pip (percentage in point) is the standard unit for measuring changes in the exchange rate in forex. For most major pairs, 1 pip is 0.0001, so EUR/USD moving from 1.1050 to 1.1057 is a +7-pip move. For JPY pairs, 1 pip is 0.01, so USD/JPY moving from 150.20 to 150.75 is a +55-pip move. Pip value depends on position size and the pair.
Use: Quoting forex price changes, calculating profit and loss, setting stops and targets.
Example: If you trade 1 standard lot (100,000) of EUR/USD, 1 pip is roughly $10. A 25-pip move in your favor is about $250 before spreads and commissions. If you trade 0.10 lot, the same 25 pips is about $25.
Position size is how much of an asset you buy or sell in a trade, measured in shares, contracts, lots, or dollar value. It is a core risk control because it determines how much you can lose if the trade goes wrong. Good position sizing links your size to your stop-loss distance and a fixed risk amount per trade, not to emotions.
Use: Risk management, money management, leverage control, and consistent trading performance.
Example: You have $25,000 and risk 1% per trade ($250). You plan to buy a stock at $50 with a stop at $48, risking $2 per share. Your position size is $250 ÷ $2 = 125 shares (about $6,250). If stopped out at $48, the loss is about $250 plus fees.
Risk management is the process of controlling how much you can lose on each trade and across your portfolio, so one bad move does not wipe you out. It includes position sizing, stop-loss rules, diversification, and setting a maximum loss per day or week. Good risk management focuses on survival first, returns second, and reduces emotional decision-making during volatility.
Use: Trading plans, portfolio construction, leverage control, and setting rules for entries, exits, and drawdowns.
Example: With a $10,000 account and a 1% risk rule, you risk $100 per trade. If your stop-loss is $2 away, you buy 50 shares ($100 ÷ $2). Even 5 losses in a row cost about $500, not your whole account.
Scalping is a short-term trading style that aims to profit from small price moves by entering and exiting quickly, often within seconds to minutes. Scalpers rely on high trade frequency, tight risk control, and low transaction costs, since spreads and fees can erase gains. It commonly uses liquid markets, fast execution, and simple signals like order flow, support and resistance, or very short-term momentum.
Use: Day trading in forex, futures, and highly liquid stocks, especially around active market hours.
Example: A scalper buys EUR/USD at 1.1000 and sells at 1.1004 for 4 pips. If the stop-loss is 3 pips and the position size makes each pip worth $5, the potential loss is $15, and the gain is $20, before spread and fees.
Settlement is the process by which a completed trade is finalized, meaning money and the asset are officially exchanged, and ownership is updated. Trading happens first; settlement occurs on the settlement date. In stocks and ETFs, settlement is often T+1 or T+2, depending on the market and rules. In forex, spot trades commonly settle in 2 business days (T+2), while many derivatives settle in cash.
Use: Trade confirmation, cash availability, delivery risk, and understanding when funds or shares actually change hands.
Example: If you buy 100 shares at $50 on Monday and the market is T+2, settlement is Wednesday. Your broker may show the position immediately, but the cash is debited, and the shares are delivered on Wednesday.
A short position is a trade where you profit if the price falls. You borrow an asset (often shares), sell it now, then aim to buy it back later at a lower price to return what you borrowed. If the price rises, losses grow, and in theory, they are unlimited because a price can keep climbing. Short selling also involves borrowing costs and the risk of a short squeeze.
Use: Bearish trading, hedging a portfolio, and market-neutral strategies.
Example: You short 100 shares at $50, receiving $5,000. If the price drops to $42, you buy back for $4,200 and profit $800 (before fees). If it rises to $60, buying back costs $6,000, a $1,000 loss.
Slippage is the difference between the price you expect for a trade and the price at which you actually get filled. It happens when the market moves quickly, liquidity is thin, or your order size is large relative to available volume. Slippage can be negative (worse fill) or positive (better fill), and it is more common during news releases, market open, and volatile crypto or small-cap stocks.
Use: Order execution, backtesting assumptions, stop-loss performance, and evaluating broker or exchange quality.
Example: You place a market buy expecting $100, but it fills at $100.30, and the slippage is $0.30 per share. On 200 shares, that is $60 extra cost. A stop-loss at $95 might be hit at $94.50 in a fast drop, widening the loss relative to your plan.
Spread is the gap between the buying price and the selling price of the same asset at the same moment. Most often, it means the bid-ask spread, where ask is what you pay to buy, and bid is what you get when you sell. A tighter spread usually indicates a more liquid market and lower trading costs.
Use: Seen on every quote in forex, stocks, options, and crypto, it is a key trading cost, especially for scalping and frequent trading.
Example: If EUR/USD is quoted 1.1000 bid and 1.1002 ask, the spread is 0.0002 (2 pips). If you buy and immediately sell, you lose 2 pips, before any fees.
A stop loss is a pre-set exit order that automatically closes your trade if the price hits a certain level, limiting your potential loss. It turns a “maybe small loss” into a known maximum loss (though fast markets can still cause some slippage). A stop loss is not a profit tool; it is a risk management tool that protects your account.
Use: Used in nearly all trading styles to control downside, plan risk per trade, and reduce emotional decisions.
Example: You buy a stock at $50 and set a stop loss at $48. If the price falls to $48, the trade closes, limiting the loss to about $2 per share (plus fees). On 100 shares, that is about $200 risk.
A stop order becomes active only after the price reaches a chosen “stop” level. Once triggered, it usually turns into a market order, aiming to get you out or in quickly, but the final fill price can differ due to slippage. A stop order can be used to limit losses (sell stop) or to enter on a breakout (buy stop).
Use: Risk control (stop-loss) and breakout entries in fast-moving markets.
Example: You buy at $50 and place a sell stop at $48. If the price trades at $48, the stop triggers and sells, maybe filling around $47.95 to $48.10. For a breakout, if the price is $100, a buy stop at $102 triggers only if the market reaches $102.
VWAP (Volume Weighted Average Price) is the average price traded during a session, weighted by volume, so heavy trading counts more than light trading. It updates throughout the day and is mainly used intraday. Many traders treat VWAP as a “fair price” line: above VWAP suggests buyers are in control, below VWAP suggests sellers are in control (not a guarantee).
Use: Day trading, execution quality checks (did you buy below VWAP?), and spotting intraday support or resistance.
Example: If VWAP is $50 and price is $51, a buyer may wait for a pullback toward $50 to avoid paying above the session’s average. If you bought at $49.80 while VWAP ended at $50.20, your execution beat VWAP by $0.40 per share.
Technical analysis terminology focuses on reading price, volume, and market behavior from charts. It includes trend concepts, support and resistance, chart patterns, momentum indicators, volatility measures, and the language traders use to describe setups, confirmations, and invalidations.
These terms are useful because they provide a consistent framework for planning trades based on probability and risk. When a chart “breaks out” or “fails,” the trader needs clear rules for what confirms the move, where it is wrong, and how position sizing changes when volatility expands or contracts.
The ADX (Average Directional Index) is a technical indicator that measures trend strength, not trend direction. It ranges from 0 to 100: higher values mean a stronger trend (up or down), while low values suggest a weak or sideways market.
Use: Chart indicators, trend-following strategies, filter for breakouts, and deciding when to avoid range-bound conditions.
Example: If EURUSD breaks out but ADX is 12, the move may be noise. If ADX rises from 18 to 28 over two weeks, trend strength is increasing, and trend trades often work better than mean reversion.
An All-Time High (ATH) is the highest price an asset has ever reached in its trading history (based on the chart’s data source and timeframe). It matters because ATH levels can act like psychological resistance: sellers may take profits, while breakouts above ATH can attract momentum buying and short covering.
Use: Charts, alerts, breakout trading, trend analysis, setting price targets, risk management, and spotting “price discovery” zones with little prior resistance.
Example: If BTC’s ATH is $73,000 and price climbs to $72,800, traders watch for rejection or a clean breakout. A daily close above $73,000, with rising volume, may signal a continuation. A sharp reversal from just below the ATH can indicate profit-taking and a possible pullback.
An All-Time Low (ATL) is the lowest price an asset has ever traded at in its recorded history (depending on the exchange/data source). It often signals extreme pessimism and can become a key support level.
Use: Risk assessment, spotting distressed assets, support/breakdown setups, and defining invalidation levels for trades.
Example: A stock with an ATL of $2.00 drops to $2.05 after bad earnings. If it breaks below $2.00 on heavy volume, that’s fresh price weakness and can trigger stops. If it holds $2.00 and rebounds to $2.40, traders may treat $2.00 as a clear risk line.
ATR (Average True Range) is a volatility indicator that measures how much an asset typically moves per period, including price gaps. True Range is the largest of today’s high minus low, absolute(high minus prior close), or absolute(low minus prior close). ATR is usually a moving average of True Range over 14 periods. It shows movement size, not direction, so a rising ATR indicates bigger swings and higher risk.
Use: Used for setting stop-loss distance, position sizing, and volatility-based breakouts.
Example: If a stock’s 14-day ATR is $2.50 and you risk $500, a 2 ATR stop is $5 away. You could buy about 100 shares ($500 ÷ $5) to match your risk plan.
A blow-off top is a sudden, steep price surge near the end of an uptrend, driven by panic buying, hype, and fear of missing out. Volume often spikes, candles get larger, and price becomes far above recent averages. It frequently ends with a sharp reversal because late buyers run out, early holders take profits, and liquidity disappears.
Use: Used in technical analysis to spot potential trend exhaustion and manage exits or tighten risk.
Example: A stock rises from $30 to $60 over 3 weeks, then jumps to $78 over 2 days on heavy volume. The next day it gaps down to $68 and closes at $62. That rapid surge and reversal is a typical blow-off top signal.
Bollinger Bands are a volatility-based indicator with three lines: a middle moving average (often a 20-period moving average), plus upper and lower bands set a certain number of standard deviations away (often 2). When volatility rises, bands widen; when volatility falls, they narrow. A price touching a band is not automatically a buy or sell signal; it often just indicates that the price is relatively high or low within the recent range.
Use: Used in technical analysis for volatility, mean reversion setups, and breakout “squeeze” signals.
Example: A stock’s 20-day average is $100, and bands are $106 and $94. If price repeatedly tags $106 and then falls back toward $100, traders may treat it as overextended. If the bands squeeze tight and price breaks above $106 on strong volume, it can signal a volatility breakout.
A breakout occurs when the price decisively moves above a resistance level or below a support level, often signaling a possible new trend. Traders look for confirmation, such as strong volume, a close beyond the level, or a volatility expansion, to avoid false breakouts.
Use: Common in technical analysis, momentum trading, and volatility-based strategies.
Example: A stock trades between $48 and $52 for a month. It then closes at $53.20 on higher-than-average volume, breaking resistance at $52. A trader buys near $53 with a stop at $51.80 (back inside the range) and targets $58 based on the $4 range height added to the breakout level.
A candlestick pattern is a recognizable shape made by one or more price candles on a chart, each candle showing open, high, low, and close for a time period. Traders use these patterns to gauge short-term sentiment, determine whether buyers or sellers are in control, and spot possible reversals or continuations. Patterns work best with context, trend direction, support and resistance, and volume.
Use: Used in technical analysis for timing entries and exits, often alongside trendlines and indicators.
Example: A “bullish engulfing” happens after a decline when a green candle fully covers the prior red candle’s body. If a stock falls to $50, then prints a red $52 to $51 candle, followed by a green $50.80 to $53 candle, it suggests buyers overwhelmed sellers, and a bounce may follow.
A channel pattern is a chart formation in which price moves between two roughly parallel trendlines, with one serving as support and the other as resistance. An upward channel suggests a steady uptrend, a downward channel suggests a steady downtrend, and a sideways channel shows range trading. Traders use channels to plan entries near support, exits near resistance, or breakout trades if the price leaves the channel with momentum.
Use: Used in technical analysis for trend trading, mean reversion, and stop-loss placement.
Example: A stock climbs in an upward channel between $48 support and $52 resistance, then both lines rise $1 per week. A trader buys near the lower line at $49, with a stop at $47.80 and a target near the upper line at $53. If the price breaks below the channel on heavy volume, it can signal a weakening trend.
A chart overlay is a technical analysis tool drawn directly on top of a price chart, so it shares the same scale as the asset’s price. Overlays help you see trend, support, and resistance, volatility, or “fair value” levels without switching to a separate indicator panel. Common overlays include moving averages, Bollinger Bands, VWAP, and trendlines.
Use: Used on trading charts to guide entries, exits, and risk levels, especially for trend following and mean reversion.
Example: If a 50-day moving average overlay sits at $100 and price pulls back from $108 to $101, a trader may watch $100 as dynamic support. A close below $100 can signal that the trend is weakening.
A chart pattern is a recognizable price formation on a trading chart that traders use to infer possible future direction, continuation, or reversal. Patterns reflect shifting supply and demand, often around support and resistance levels, and they work best when combined with volume, trend context, and risk management. Common chart patterns include triangles, flags, head-and-shoulders patterns, and double tops or bottoms.
Use: Used in technical analysis to plan entries, exits, targets, and stop-loss placement.
Example: A stock ranges between $48 (support) and $52 (resistance) for 4 weeks, then closes at $53 on higher volume. Traders may treat it as an upside breakout, target about $57 (range height $4 added to $53), and place a stop near $51.80.
A choppy market is one in which prices move back and forth with no clear trend, leading to frequent false breakouts and whipsaws. Volatility can be high or low, but direction is inconsistent, so trend-following strategies often struggle. Choppy periods usually occur during periods of uncertainty, mixed economic data, or when the market is waiting for a major catalyst.
Use: Used in trading to describe range-bound price action and to adjust strategy, position size, and stop placement.
Example: An index trades between 4,900 and 5,050 for three weeks, repeatedly breaking above 5,050 intraday but closing back inside the range. A trend trader buying each “breakout” gets stopped out repeatedly. A range trader may instead sell near 5,050 and buy near 4,900 with tight risk controls.
Consolidation is a market phase where price moves sideways in a relatively tight range after a prior move, as buyers and sellers reach a temporary balance. It often shows lower volatility and can form chart patterns like ranges, flags, or triangles. Consolidation is not a reversal by itself; it is a pause that can lead to either a breakout higher or a breakdown lower.
Use: Technical analysis to plan entries, set stop-loss levels, and trade breakouts or range bounces.
Example: A stock rallies from $40 to $50, then trades between $48 and $51 for 3 weeks. A breakout above $51 with higher volume may signal continuation, while a drop below $48 could signal a bearish move.
A daily candle (daily candlestick) is a price bar that summarizes one full trading day. It shows the open, high, low, and close (OHLC) for that day. The candle body represents the open-to-close range, and the wicks show the day’s extremes.
Use: Technical analysis on daily charts for stocks, forex, crypto, and indices.
Example: A stock opens at $100, trades up to $108, down to $98, and closes at $106. The candle is bullish with a body from $100 to $106 and wicks reaching $108 and $98, suggesting buyers controlled the close despite some selling pressure.
A daily chart is a price chart in which each data point represents one trading day, commonly shown as a daily candlestick or bar with OHLC data and, often, volume. It smooths out intraday noise and is widely used to identify the main trend, key support and resistance levels, and higher-probability setups.
Use: Trend analysis, swing trade planning, stop placement, and multi-timeframe analysis.
Example: If a stock forms higher highs and higher lows on the daily chart for 8 weeks, the trend is up. A trader might wait for a pullback to a prior support zone, then place a stop below the recent daily swing low and target the next resistance area.
Daily range is the distance between the day’s high and the day’s low for an asset. It measures intraday volatility and is often expressed in points, dollars, or pips. A larger daily range usually means more movement and potentially more opportunity, but also higher risk and wider stops.
Use: Volatility assessment, setting stop-loss and take-profit distances, sizing positions, and choosing trading times.
Example: If EUR/USD trades from 1.0900 (low) to 1.0985 (high), the daily range is 85 pips. If its 14-day ATR is 60 pips, today is unusually volatile, so a 15-pip stop may be too tight and likely to get hit by normal swings.
A dead cat bounce is a short-lived price rebound after a steep decline, followed by the resumption of the downtrend. It often happens when oversold conditions trigger bargain buying, short-covering, or hopeful news, but the underlying fundamentals or trend have not improved.
Use: Bear-market analysis, short-selling strategy, risk control after sharp drops.
Example: A stock falls from $100 to $60 in two weeks, then rallies to $70 over three days. If it fails near prior support at $72 and then breaks back below $60, that rebound was a dead cat bounce, not a trend change.
Divergence occurs when price moves in one direction while a technical indicator moves in the opposite direction, suggesting momentum is weakening, and the trend may pause or reverse. The most common types are bearish divergence (when price makes a higher high and the indicator makes a lower high) and bullish divergence (when price makes a lower low and the indicator makes a higher low). Divergence is a warning signal, not a guaranteed entry.
Use: Momentum analysis with RSI, MACD, stochastic, and confirming reversals at support or resistance.
Example: A stock rallies from $90 to $110, then pushes to $115, but RSI peaks at 72 on the first high and only 64 on the second. That bearish divergence shows weaker buying pressure, so a trader might tighten a stop or wait for a break below a daily support level before shorting.
A doji candle is a candlestick with an open and close that are the same or very close together, creating a small or flat body. It signals indecision; neither buyers nor sellers controlled the close, and it often appears near turning points or during trend pauses. Dojis matter most when they form at clear support or resistance and are confirmed by the next candle and volume.
Use: Candlestick analysis, spotting potential reversals, and timing entries with confirmation.
Example: An uptrend pushes to $120, then prints a doji with a high at $121 and a low at $118, closing near $119.80. If the next day closes below $118 with higher volume, that confirms selling strength and the doji becomes an early reversal warning.
A Donchian Channel is a technical indicator that plots three lines based on the highest high and lowest low over a chosen lookback period (N). The upper band is the highest price over the last N periods, the lower band is the lowest, and the middle line is their average. It helps visualize breakouts, trends, and volatility.
Use: Trend-following breakout systems, support and resistance, trailing stops (often with 20-period channels).
Example: On a daily chart with N = 20, the upper band is $105, and the lower band is $95. If the price closes above $105, a trader may treat it as an upside breakout and place a trailing stop near the lower band or a shorter Donchian low (like 10-day) to manage risk.
A double bottom is a bullish reversal chart pattern in which the price tests a similar low twice, with a rebound in between, suggesting that selling pressure is fading. The pattern is usually confirmed when the price breaks above the “neckline,” the swing high between the two lows. Without a neckline break, it is just a potential setup, not a confirmed reversal.
Use: Technical analysis for spotting trend reversals, planning breakout entries, and setting stops.
Example: A stock falls to $50, bounces to $58, then drops again to $51 and holds. The neckline is $58. If the price closes above $58 with stronger volume, a trader may buy with a stop below $50 and a target near $66 (neckline $58 plus pattern height $8).
A double top is a bearish reversal chart pattern in which the price reaches a similar high twice, with a pullback in between, suggesting that buyers are losing control. The pattern is confirmed when the price breaks below the “neckline,” the swing low between the two peaks. Until that breakdown happens, it is only a warning, not a completed reversal.
Use: Spotting potential trend reversals, timing exits on long positions, and planning short trades.
Example: A stock rallies to $100, drops to $92, then rallies again to $99 and stalls. The neckline is $92. If it closes below $92, a trader might short with a stop above $100 and a target near $84 (neckline $92 minus pattern height $8).
A downtrend is a market condition in which prices generally move lower over time, as shown by lower highs and lower lows. It reflects sustained selling pressure and bearish sentiment. Traders often define a downtrend using trendlines, moving averages (price below a falling average), or structure (each rally fails to break above the prior peak). In a downtrend, rallies are often treated as potential sell opportunities until the structure breaks.
Use: Trend analysis, short-selling setups, risk management, and choosing trade direction.
Example: A stock peaks at $120, then drops to $110, rallies to $116, falls to $104, rallies to $108, then falls again. Those lower highs ($116, $108) and lower lows ($110, $104) confirm a downtrend, so a trader might place a stop above the last lower high when shorting.
EMA (Exponential Moving Average) is a moving average that weights recent prices more heavily than older prices, so it reacts faster to new information than a simple moving average (SMA). Traders use EMAs to identify trend direction, dynamic support and resistance, and momentum shifts. Common settings include 9, 20, 50, and 200 periods, and EMA crossovers can signal potential trend changes, but they lag price.
Use: Technical analysis across stocks, forex, crypto, and indices, for trend filters and entry timing.
Example: On a daily chart, the price stays above the 50-day EMA for weeks, suggesting an uptrend. If the price closes below the 50-day EMA and the 20-day EMA crosses below it, that signals weakening momentum. A trader might reduce long exposure or wait for a pullback to the EMA that fails to reclaim it before shorting.
A fakeout is when the price briefly breaks above resistance or below support, triggering entries and stop orders, but then quickly reverses back into the prior range. It often occurs at obvious levels where many traders place breakout trades, and it can be fueled by low liquidity or stop-hunting. Fakeouts are common, so traders often wait for confirmation, like a close beyond the level or a retest that holds.
Use: Breakout trading, support and resistance, stop placement, and risk control in volatile markets.
Example: A stock ranges between $48 and $50 for two weeks. It spikes to $50.60 intraday, pulling in breakout buyers, but closes back at $49.70. The next day, it drops to $48.80. That move above $50 was a fakeout, and traders who waited for a daily close above $50 avoided the trap.
A Fibonacci extension is a tool traders use to project potential profit targets beyond a prior swing high or low, based on common Fibonacci ratios like 1.272, 1.618, and 2.618. It is drawn using three points, a swing low, a swing high, and then a pullback, to estimate where the next impulse move might reach. Extensions are best treated as target zones rather than exact prices.
Use: Setting take-profit levels in trending markets, planning reward-to-risk, mapping resistance, and support.
Example: Price rises from $100 to $120, then pulls back to $112. The 1.618 extension targets about $132.94: $112 + 1.618 × ($120 − $100) = $112 + $32.36. A trader might scale out near $133 and trail a stop if momentum stays strong.
A Fibonacci retracement is a chart tool that marks potential support or resistance levels during a pullback, using common Fibonacci ratios like 38.2%, 50%, and 61.8% of a prior price swing. Traders draw it from a swing low to a swing high in an uptrend (or from a swing high to a swing low in a downtrend) to estimate where the price might pause or reverse. It works best when levels align with the structure, such as prior highs and lows or moving averages.
Use: Planning pullback entries, setting stops, and identifying target zones.
Example: A stock rallies from $100 to $140, a $40 move. The 50% retracement is $120, and the 61.8% level is $115.28 ($140 − 0.618 × $40). If price pulls back to $120 and prints a bullish daily candle, a trader may buy with a stop below $115 and target a retest of $140.
A flag pattern is a continuation setup in which price makes a sharp move (the flagpole), then consolidates in a small, sloping channel or a tight range (the flag) before potentially breaking out in the original direction. It reflects a brief pause as traders take profits, then the trend resumes if demand or supply returns. Confirmation usually comes from a breakout with a close beyond the flag boundary and rising volume.
Use: Trend trading, breakout entries, setting targets and stops, and timing pullbacks.
Example: A stock jumps from $50 to $60 in three days (flagpole), then drifts down between $59 and $57 for a week (flag). If it breaks above $59.50 and closes strongly, a trader may buy with a stop below $57 and target around $69 to $70 by projecting the $10 flagpole from the breakout area.
Gapping is when an asset’s price jumps from one level to another with no trading in between, creating a “gap” on the chart. It often happens between sessions, like after the close of the next open, due to news, earnings, or sudden shifts in supply and demand. Gaps matter because stops may fill worse than expected, and gaps can later act as support or resistance.
Use: Earnings trading, risk management, setting stop-loss expectations, and reading market sentiment.
Example: A stock closes at $50, then reports earnings overnight and opens at $56. That $6 gap up can trigger a buying rush, but if it later falls back below $56, the gap area can become resistance.
Heiken Ashi is a type of candlestick chart that uses averaged price data to smooth out noise and make trends easier to see. Each Heiken Ashi candle is calculated from the prior candle and the current period’s OHLC, so it lags more than standard candles but often shows cleaner runs of the same color in trends. Traders use it to stay in trends longer and reduce whipsaws.
Use: Trend-following, trailing stop decisions, and filtering choppy markets on stocks, forex, and crypto.
Example: On a daily chart, a strong uptrend may print many consecutive green Heiken Ashi candles with small lower wicks. A common rule is to stay long until you see a color change plus a larger opposite wick, then tighten a stop under the recent swing low.
An inside bar is a candlestick whose high and low are completely within the prior candle’s high and low. It shows consolidation and reduced volatility, often acting like a “pause” before the next directional move. Inside bars can be continuation setups in trends or reversal clues at key support or resistance, but they need confirmation, usually a break above the inside bar high or below its low.
Use: Price action trading, breakout entries, stop placement, and volatility compression.
Example: Day 1 ranges from $100 to $110. Day 2 ranges from $103 to $108, an inside bar. A trader might place a buy stop at $110.10 and a sell stop at $99.90, then follow the breakout. If the price breaks out but quickly falls back into the range, it can be a fakeout, so risk control is key.
Intraday volatility is how much an asset’s price fluctuates within a single trading day. It reflects the size and speed of moves from open to close, including swings around news, market opens, and low-liquidity periods. Higher intraday volatility can create more trading opportunities, but it also increases slippage risk and the chance your stop-loss gets hit.
Use: Day trading, setting stop-loss and take-profit distances, position sizing, and choosing when to trade.
Example: A stock opens at $100, spikes to $106, drops to $98, and closes at $101. That wide swing signals high intraday volatility. A trader using a $1 stop may get stopped out by normal noise, while a trader risking $3 might survive the swings but must reduce share size to keep risk controlled.
MACD (Moving Average Convergence Divergence) is a momentum indicator that compares two exponential moving averages (commonly 12 and 26 periods). The MACD line is the difference between those EMAs; the signal line is usually a 9-period EMA of the MACD line, and the histogram shows the gap between the MACD line and the signal line. It helps identify trend momentum and potential shifts.
Use: Technical analysis for momentum, trend confirmation, crossovers, and divergence on stocks, forex, and crypto.
Example: On a daily chart, MACD crosses above the signal line while both are below 0, suggesting bearish momentum is fading. If the price then breaks resistance and MACD moves above 0, it often confirms a stronger bullish trend.
A moving average is an indicator that smooths price data by calculating an average over a set number of periods, such as 20 or 200 days. It helps reveal the underlying trend and can act as dynamic support or resistance. The two common types are SMA (simple moving average) and EMA (exponential moving average), with EMA responding more quickly to recent price changes. Moving averages lag price, so they work best with other confirmation tools.
Use: Trend filters, crossover signals, support and resistance, and timing entries or exits.
Example: A stock trades above its 200-day SMA for months, suggesting a long-term uptrend. If it breaks below the 200-day and the 50-day SMA crosses under it (a “death cross”), many traders treat that as a bearish signal and may reduce long exposure or look for short setups.
OBV (On-Balance Volume) is a momentum indicator that adds volume on days the price closes up and subtracts volume on days the price closes down. The idea is that volume often leads price, so rising OBV suggests accumulation (buying pressure) and falling OBV suggests distribution (selling pressure). OBV is most useful for confirming breakouts and spotting divergences.
Use: Trend confirmation, breakout validation, and bullish or bearish divergence in technical analysis.
Example: A stock breaks above $50, but OBV remains flat, so the breakout lacks strong buying pressure. If OBV hits a new high near $50, buyers may be accumulating, and the breakout could continue.
An order block is a price zone where large traders are likely to have placed large buy or sell orders, as shown on a chart by the final opposing candle before a strong, impulsive move. Traders treat that zone as potential future support (bullish order block) or resistance (bearish order block) when the price returns, expecting liquidity and institutional order flow to react there. It is a concept popular among “smart money” and supply-and-demand traders.
Use: Finding high-probability areas to enter on pullbacks, placing stops beyond the zone, and mapping support and resistance.
Example: Price drops to $95, then rallies hard to $110. The last bearish candle before the rally spans $96 to $98, which is the bullish order block. If the price later pulls back into $96–$98 and holds, a trader may go long with a stop below $95 and a target at the prior high near $110.
Overbought means an asset has risen quickly and may be due for a pause, pullback, or consolidation because buying momentum is stretched. It is usually identified using indicators such as RSI, stochastic, or the distance from a moving average. Overbought does not mean the price must fall; strong trends can remain overbought for a long time, so it is best used as a warning rather than a sell signal on its own.
Use: Momentum analysis, timing entries and exits, avoiding chasing rallies, and spotting potential reversals near resistance.
Example: RSI on a stock reaches 78 after a 15% rally in 10 days. Instead of shorting immediately, a trader might wait for confirmation, like a lower high, a break below a recent support level, or a bearish reversal candle. In a strong uptrend, RSI can hover above 70 while price keeps rising, so a stop-loss is important.
Oversold means an asset has fallen quickly and may be due for a bounce, pause, or consolidation because selling momentum is stretched. Traders often spot it using indicators like RSI (for example, below 30), stochastic, or large moves away from a moving average. Oversold conditions do not guarantee a reversal; strong downtrends can remain oversold for long periods, so they should be treated as a warning signal.
Use: Momentum analysis, identifying potential bounce zones, and timing entries with confirmation near support.
Example: A stock drops from $80 to $68 in a week, and RSI hits 25. A trader might wait for a bullish daily candle or a break above $70 before buying. If price keeps making lower lows, the “oversold” reading can persist, and buying too early can be costly, so stops and small sizing are important.
Price action is analyzing market movement using only price behavior, like highs and lows, candlestick patterns, and support and resistance, rather than relying heavily on indicators. It focuses on how buyers and sellers interact at key levels and how trends form through market structure. Price action traders often use tools like trendlines, inside bars, pin bars, and breakouts, but the core input is the chart’s raw price.
Use: Technical trading in stocks, forex, and crypto, especially for timing entries and exits.
Example: A stock is in an uptrend and pulls back to a prior support zone near $95. It prints a bullish pin bar with a long lower wick and closes above $96, showing buyers defended the level. A trader might enter near $96 with a stop below $94 and target the prior high at $105, using the structure to define risk and reward.
Range trading is a strategy that assumes the price will bounce between clear support and resistance levels rather than trend. Traders buy near the lower boundary (support) and sell near the upper boundary (resistance), often using oscillators like RSI to confirm overbought or oversold conditions. It works best in quiet, sideways markets and tends to fail when a breakout starts, so risk control around range edges is crucial.
Use: Sideways markets, mean reversion setups, short-term swing trades, and low-volatility periods.
Example: A stock trades between $48 support and $52 resistance for a month. A range trader buys near $48.30 with a stop at $47.60 and a target at $51.70. If the price closes above $52 with strong volume, they stop range trading and avoid shorting the breakout, because the range may be ending.
A retracement is a temporary price pullback that moves against the current trend, often viewed as a “pause” rather than a full trend reversal. Traders measure retracements to estimate where the price might find support or resistance before the trend resumes. Fibonacci retracement levels (like 38.2%, 50%, 61.8%) are common reference points, but they are not guarantees.
Use: Technical analysis for planning entries, adding to positions, setting stop-losses, and targeting buy zones in an uptrend or sell zones in a downtrend.
Example: A stock rallies from $100 to $130, then drops to $118, a 40% retracement of the $30 move. A trader may watch $115 to $120 for support and place a stop below $115.
A reversal is a meaningful change in price direction where an uptrend turns into a downtrend, or a downtrend turns into an uptrend. Unlike a retracement, a reversal suggests the prior trend may be ending, often confirmed by a break of key support or resistance, a switch from higher highs and higher lows to lower highs and lower lows, or strong volume and momentum shifts.
Use: Technical analysis for trend change signals, risk management, and trade entries around support, resistance, and chart patterns.
Example: A stock trends up to $50, then fails twice near $50 and breaks support at $46 on high volume. Traders may treat that $46 break as a bearish reversal and set a stop above $48.
RSI (Relative Strength Index) is a momentum indicator that compares recent gains to recent losses to show how strong a price move is, on a 0 to 100 scale, often calculated over 14 periods. It is used to spot overbought and oversold conditions and to judge trend strength. Many traders use 70 and 30 as common thresholds, but in strong trends, the RSI can remain high or low for extended periods.
Use: Technical analysis for entry timing, confirming trends, and identifying RSI divergence.
Example: If RSI climbs to 75 after a fast rally, a trader may avoid chasing and wait for RSI to cool below 70. If price makes a new low but RSI makes a higher low, that bullish divergence can hint that selling pressure is weakening.
SMA (Simple Moving Average) is a trend indicator that shows the average price over a set number of periods, such as 20 or 200 days. It smooths out noise so you can see the underlying direction. Each new period, the oldest price drops out, and the newest price is added. Shorter SMAs react faster but whipsaw more; longer SMAs are steadier but slower.
Use: Technical analysis for trend direction, dynamic support and resistance, and crossover signals (for example, 50 SMA vs 200 SMA).
Example: A 20-day SMA at $52 means the last 20 daily closes average $52. If the price stays above the 50-day SMA for weeks, traders often treat the trend as bullish. If the 50-day SMA crosses below the 200-day SMA, some see it as a bearish “death cross.”
The Stochastic Indicator (Stochastic Oscillator) is a momentum tool that shows where the current price closed relative to its recent high-to-low range, on a 0-100 scale. It helps estimate whether the price is closing near the top of its range (strong buying) or near the bottom (strong selling). Common levels are above 80 (overbought) and below 20 (oversold), but trends can stay there for a while.
Use: Technical analysis for timing entries and exits, spotting momentum shifts, and divergences.
Example: Over the last 14 days, a stock ranged from $90 to $100 and closed at $98. It is near the top of the range, so stochastic may read around 80-90. If price keeps rising while stochastic falls from 88 to 70, that divergence can signal that momentum is fading.
A support level is a price area where an asset has often stopped falling and bounced up before, because buying demand tends to appear there. It is not an exact line, more like a zone. Support can come from past lows, a round number, a moving average, or heavy trading volume. If support breaks, that level can later act as resistance.
Use: Technical analysis for planning buy zones, placing stop-losses, and setting targets.
Example: A stock drops to around $40 three times and rebounds each time, so $40 becomes support. A trader might buy near $41 with a stop at $39.50. If the price closes below $40 and keeps falling, that suggests support failed, and risk is higher.
Technical analysis (TA) is a way to make trading decisions by studying price charts and trading volume rather than focusing on a company’s financials or the broader economy. It assumes price already reflects available information, and that patterns and trends can repeat. Common tools include support and resistance, moving averages, RSI, and chart patterns. It does not guarantee results; it helps you plan entries, exits, and risk.
Use: Used by day traders and swing traders to time trades, set stop-loss levels, and identify trends.
Example: A trader sees a stock holding support near $50 and the 50-day SMA rising. They buy at $51, set a stop at $49, and target $58, near the next resistance level.
A trend is the general direction an asset’s price moves over time. An uptrend means prices are mostly making higher highs and higher lows. A downtrend means lower highs and lower lows. If price moves sideways without clear highs or lows, it’s a range (no strong trend). Traders use trends to decide whether to buy, sell, or stay out.
Use: Chart reading, technical analysis, choosing trade direction, and setting entries, stops, and targets.
Example: A stock goes $50 → $54 → $52 → $58 → $55. The highs and lows are rising, so it’s an uptrend. A trader might buy near $55 with a stop at $52 and target $60 to follow the trend.
A volatility stop is a stop-loss level that adjusts based on the price's typical volatility. Instead of using a fixed dollar amount, it uses a volatility measure (often ATR, Average True Range) so the stop is wider in choppy markets and tighter in calm markets. Many traders use it as a trailing stop to stay in trends while avoiding getting stopped out by normal noise.
Use: Risk management and trend-following exits, especially when volatility changes a lot.
Example: A stock is $100, and its 14-day ATR is $2. If you use 3× ATR, your volatility stop is $6 away. For a long trade, the stop starts at $94. If the price rises to $110 and ATR stays $2, the trailing stop can move up to about $104.
Volume Oscillator is a technical indicator that compares short-term trading volume to longer-term trading volume to show whether volume is increasing or decreasing. It’s usually calculated using two moving averages of volume (e.g., 14- and 28-period) and plotted as a line above or below the zero line. A rising, positive oscillator suggests growing participation, a falling, negative one suggests weakening participation.
Use: Confirming breakouts, trend strength, and spotting when price moves are not supported by volume.
Example: If the 14-day average volume is 1.2M shares and the 28-day average is 1.0M, the oscillator is positive (about +20%). If price breaks resistance while the oscillator is negative, the breakout may be less reliable.
Volume Profile is a chart tool that shows how much trading volume happened at each price level over a chosen period. Instead of volume bars by time, it draws a horizontal histogram on the price axis. Price areas with heavy volume often act like “acceptance” zones where trading is busy, while low-volume areas can act like “rejection” zones where price may move quickly.
Use: Technical analysis to find support and resistance zones, value areas, and likely breakout or bounce levels.
Example: Over the last 20 days, the profile shows the highest volume around $100, but very low volume from $103 to $105. If the price returns to $100, buyers may defend it. If price breaks above $103, it may travel faster through $103 to $105 because fewer trades occurred there.
Fundamental analysis terminology describes how a business is valued using its financial performance, balance sheet strength, cash generation, and competitive position. It includes revenue, margins, earnings, free cash flow, valuation multiples, guidance, and how corporate actions or accounting choices can change reported results.
These terms help investors connect price to underlying economics. If you can interpret how profit quality differs from headline earnings, what leverage implies in a downturn, or why a higher multiple may be justified by stronger growth and returns on capital, you can compare companies with more precision.
ADP Payrolls (the ADP National Employment Report) is a monthly estimate of the number of private-sector jobs added or lost in the U.S., based on payroll data processed by ADP (Automatic Data Processing). Traders watch it as an early signal for labor-market strength before the official Nonfarm Payrolls (NFP), but it often differs from the government’s figure.
Use: U.S. economic calendar, FX (USD), Treasury yields, stock index futures, Fed rate expectations, and “jobs data” headlines.
Example: If ADP prints +220,000 vs. the expected +150,000, markets may price a hotter economy. USD can rise, and bond yields may tick up, as markets anticipate firmer NFP and stickier inflation.
An annual report is a company’s once-a-year summary of its business and financial performance. For public companies, it typically includes audited financial statements, management discussion (MD&A), risks, strategy, and notes explaining accounting details. In the U.S., the annual report is closely tied to the Form 10-K filing; other countries have similar mandated annual filings.
Use: Fundamental analysis, long-term investing decisions, comparing companies, and checking debt, cash flow, margins, and risk disclosures.
Example: If a firm reports $5.0B revenue, $400M net income, and $900M operating cash flow, the annual report’s notes may show why cash flow is higher (e.g., working-capital changes) or reveal risks like a large debt maturity next year, key for valuing the stock and sizing risk.
Asset inflation is a broad rise in the prices of financial assets like stocks, real estate, and bonds, even if everyday consumer prices are not rising as fast. It often happens when interest rates are low, credit is easy, or investors chase returns, pushing valuations higher.
Use: Used in macroeconomic commentary, central bank debates, and valuation analysis.
Example: If mortgage rates fall from 6% to 3%, buyers can afford larger loans, so home prices may jump 20% while CPI rises only 3%. That is asset inflation.
A black swan event is a rare, hard-to-predict shock that has a significant market impact and is often only explained after it occurs. In trading, it refers to tail risk, events outside normal expectations that can trigger sudden crashes, liquidity freezes, and volatility spikes.
Use: Used in risk management, portfolio stress testing, and discussions of tail events and extreme volatility.
Example: A fund targets a maximum drawdown of 10% based on recent volatility. A sudden crisis causes a 25% index drop in days, spreads widen, stops slip, and leveraged positions face margin calls, turning “unlikely” losses into real ones fast.
Book value is the net value of a company based on its balance sheet, total assets minus total liabilities. It is also called shareholders’ equity. Book value per share (BVPS) is equity divided by shares outstanding. It can be a rough floor for asset-heavy firms, but it may be less useful for businesses with big intangibles (software, brands) or outdated asset values.
Use: Used in fundamental analysis and valuation ratios like price-to-book (P/B), especially for banks and insurers.
Example: Assets $500m, liabilities $350m, book value $150m. With 50m shares, BVPS is $3.00. If the stock trades at $6, P/B is 2.0.
CPI (Consumer Price Index) is a measure of inflation that tracks how the average prices of a basket of everyday goods and services change over time, such as food, housing, transportation, and healthcare. It is published regularly and reported as a percentage change, often month-over-month and year-over-year. Many analysts also monitor the core CPI, which excludes food and energy, to gauge underlying inflation trends.
Use: Macroeconomic analysis, central bank policy expectations, interest rates, and adjusting wages or contracts for the cost of living.
Example: If CPI rises 0.4% in a month and 3.2% year over year, prices are increasing faster than a 2% target. Markets may price in higher rates, which can pressure bond prices and high-growth stocks.
Currency depreciation occurs when a currency loses value relative to another currency, so it takes more of the depreciating currency to buy the same amount of the other currency. Depreciation can occur under floating exchange rates due to market forces or in managed systems through policy changes. Common drivers include lower interest rates, higher inflation, weaker growth, capital outflows, and rising political or credit risk.
Use: Forex analysis, importing and exporting costs, inflation expectations, and hedging foreign currency exposure.
Example: If EUR/USD falls from 1.10 to 1.05, the euro depreciated versus the dollar by about 4.5% (0.05 ÷ 1.10). Euro-priced imports, such as oil, become more expensive in EUR, which can push domestic inflation higher even if global prices remain unchanged.
Currency intervention is when a central bank buys or sells its own currency (or foreign currencies) to influence the exchange rate. The goal is usually to slow a rapid fall, limit excessive strength, calm volatility, or support inflation and financial stability. Intervention can be verbal (signals and warnings) or direct (actual market transactions), and it may be “sterilized” if the bank offsets the impact on domestic money supply.
Use: Forex markets, central bank policy, crisis management, and exchange-rate targeting.
Example: If USD/JPY jumps from 150 to 158 quickly, Japan’s central bank might sell USD and buy JPY to push USD/JPY back down, reducing yen weakness and import-driven inflation.
A currency peg is a fixed exchange-rate system in which a country’s central bank maintains its currency at a set rate (or a tight band) against another currency, often USD, or against a basket. The bank uses interest rates and foreign exchange reserves to defend the peg, which can stabilize trade and inflation, but reduces monetary policy flexibility and can break under heavy market pressure.
Use: Fixed exchange rate policy, emerging-market stability, capital flow management, and FX risk analysis.
Example: If a country pegs at 5.00 per USD, it must keep USD/Local near 5.00. If traders push it to 5.20, the central bank may sell USD reserves and buy its currency to pull the rate back.
The current account is part of a country’s balance of payments and tracks money flowing in and out through trade in goods and services, net investment income (such as dividends and interest), and one-way transfers (such as remittances). A surplus means the country earns more from the rest of the world than it pays, a deficit means the opposite.
Use: Macro analysis, FX forecasting, country risk, and interest rate expectations.
Example: If a country imports $120B and exports $100B, and net income plus transfers add $5B, the current account is -$15B. To finance it, foreigners must invest $15B, or the currency may weaken, reducing imports and boosting exports.
A current account deficit occurs when a country spends more on foreign goods, services, and net income payments than it earns, after accounting for transfers such as remittances. It means the country must be financed by foreign capital (selling assets, borrowing, or attracting investment). Deficits are not always bad, but large or persistent ones can raise external debt risk and, if investors lose confidence, sometimes pressure the exchange rate.
Use: FX analysis, sovereign risk, macro trading, and capital flow monitoring.
Example: If exports are $200B, imports are $260B, and net income and transfers are -$10B, the current account is -$70B. The country must attract $70B in net capital inflows, or its currency may depreciate to curb imports and lift exports.
Default risk is the chance that a borrower, such as a company, household, or government, will fail to make interest or principal payments on time. Higher default risk usually means lenders demand higher yields, stricter terms, or collateral. It depends on cash flow, debt levels, economic conditions, and credit quality, often summarized by credit ratings and bond spreads.
Use: Bonds, loans, credit analysis, CDS pricing, and corporate finance.
Example: Two 5-year bonds are similar, but Bond A yields 4% and Bond B yields 7%. The extra 3% is the credit spread, compensation investors demand for higher default risk in Bond B.
Deflation is a sustained decline in the general price level of goods and services, meaning money gains purchasing power over time. It often occurs when demand is weak, credit shrinks, or productivity rises faster than spending. Deflation can be harmful because it encourages consumers and businesses to delay purchases, reduces revenues, and increases the real burden of debt (loans become harder to repay in “today’s dollars”).
Use: Macro analysis, central bank policy, bond markets, and recession risk monitoring.
Example: If inflation is -2% for a year, a $1,000 basket of goods falls to about $980. A household with a fixed $200,000 mortgage effectively owes more in real terms, even though the nominal balance barely changes.
Deleveraging is the process of reducing debt and leverage by paying down borrowings, selling assets, or raising equity. It can happen at the company level, household level, or across an entire economy. Deleveraging often lowers risk over time, but it can also slow growth in the short run because spending and investment drop, and forced selling can push asset prices down.
Use: Credit cycles, corporate balance sheet analysis, recession and crisis dynamics, risk management.
Example: A company has $100M in assets, funded by $80M in debt and $20M in equity (4x leverage). If it sells $20M of assets and uses the cash to repay debt, it becomes $80M in assets, $60M in debt, and $20M in equity, reducing leverage and interest costs.
Dovish describes a central bank or policy stance that prioritizes supporting economic growth and jobs, even if it means tolerating higher inflation. A dovish central bank is more likely to cut interest rates, keep rates lower for longer, or add liquidity through asset purchases. In markets, “dovish” usually implies easier monetary policy and lower expected future rates.
Use: Central bank statements (Fed, ECB, BOE, BOJ), bond yields, FX moves, and rate-sensitive stocks.
Example: If the Fed signals “rate cuts may start soon” and downplays inflation risks, traders may call it dovish. USD can weaken, and Treasury yields often fall as markets price in lower rates.
DXY (US Dollar Index) is an index that tracks the U.S. dollar’s value versus a basket of major currencies, so you can gauge broad USD strength or weakness in one number. It is a weighted geometric measure using six currencies, with the euro (about 57.6% weight) heavily weighted, followed by JPY, GBP, CAD, SEK, and CHF.
Use: Macro and forex analysis, hedging USD exposure, and spotting when USD strength may pressure commodities and emerging markets.
Example: If DXY rises from 100 to 105, the USD strengthened about 5% versus the basket. Because EUR has the largest weight, a falling EUR/USD often drives a big part of that move.
An economic calendar is a schedule of upcoming economic data releases and central bank events that can move markets, such as CPI inflation, jobs reports, GDP, PMI surveys, and rate decisions. It lists the date and time, forecast, previous value, and the actual number when released, helping traders anticipate volatility and plan risk.
Use: Forex and index trading, news risk management, timing entries, and avoiding surprise volatility.
Example: You see the US CPI due at 8:30 a.m. ET with a forecast of 0.2% m/m. If the actual prints 0.5%, yields may jump, and USD could strengthen quickly. A trader might reduce position size, widen stops, or wait 10–15 minutes after the release before trading.
Economic indicators are official statistics that measure how an economy is performing, such as growth, inflation, jobs, and business activity. Traders and investors use them to estimate where interest rates, corporate profits, and currencies may go next. Indicators can be leading (PMI, consumer confidence), coincident (GDP, retail sales), or lagging (unemployment rate trends).
Use: Macro analysis, forecasting central bank moves, and timing trades around data releases.
Example: If US CPI is forecast at 0.2% m/m but prints 0.5%, markets may price fewer rate cuts, pushing 10-year yields up. USD can strengthen while rate-sensitive stocks may drop that day.
Event risk is the chance that a specific event will cause a sudden, outsized price move, increased volatility, or liquidity problems. Events can be scheduled (earnings, CPI, central bank decisions) or unexpected (geopolitical shocks, lawsuits, hacks). Event risk matters because prices can gap, spreads can widen, and stop-loss orders can fill worse than planned (slippage).
Use: Risk management around news, sizing positions, choosing whether to hedge, and planning trades around the economic calendar.
Example: A stock closes at $100 before earnings, and options imply a 5% move. After the results, it opens at $88 (-12%). A stop at $96 might be hit near $88, turning a planned 4% loss into a 12% loss, so traders often reduce size or hedge with options before the event.
The Fed funds rate is the interest rate at which banks lend and borrow reserve balances overnight in the US. The Federal Reserve does not set the exact market rate; it sets a target range and uses its tools to keep the effective rate trading within that range. Because it anchors short-term borrowing costs, it influences other rates, such as bank prime rates, credit card rates, mortgage rates, and Treasury yields.
Use: FOMC policy decisions, pricing rate cuts or hikes, bond and USD direction.
Example: If the Fed raises the target range from 5.25%–5.50% to 5.50%–5.75%, money market yields and short-term Treasury yields often rise. A variable-rate loan may reprice higher, and USD can strengthen if other countries’ rates stay lower.
A fiscal deficit happens when a government spends more than it collects in revenue (taxes and other income) over a period, usually a year. The gap is funded by borrowing, which increases government debt. Deficits can support growth during recessions, but large or persistent deficits may raise bond yields, increase inflationary pressures, or weaken investor confidence, depending on a country’s credibility and currency status.
Use: Macro analysis, sovereign bond markets, credit ratings, and FX risk.
Example: If a government collects $900B but spends $1.1T, the fiscal deficit is $200B. To fund it, it issues $200B of new bonds. If investors demand a higher yield to buy those bonds, borrowing costs rise and can spill into higher loan rates across the economy.
Fiscal policy is how a government uses spending, taxes, and budget deficits or surpluses to influence the economy. Expansionary fiscal policy increases spending or cuts taxes to boost demand and jobs, while contractionary fiscal policy reduces spending or raises taxes to cool inflation or reduce debt. Fiscal policy can affect growth, inflation, and interest rates, and it often works alongside, or against, central bank monetary policy.
Use: Macro analysis, budget announcements, stimulus packages, and bond market expectations.
Example: During a slowdown, a government approves a $300B infrastructure program funded by new bonds. Construction jobs rise and demand increases, which can lift GDP. If the economy is already hot, that extra spending may push inflation higher, leading bond yields to rise and the central bank to stay tighter for longer.
A fixed exchange rate is a system in which a country’s currency is pegged to a set value against another currency (often USD) or a basket. The central bank maintains the rate by buying or selling its currency and using tools like interest rates and capital controls. Fixed rates can stabilize trade and inflation expectations, but they require large reserves and can break if markets doubt the peg.
Use: Currency policy, FX risk analysis, and understanding pegs, bands, and devaluations.
Example: If a country fixes at 3.50 per USD, it tries to keep USD/Local near 3.50. If demand for USD pushes the rate to 3.60, the central bank may sell USD reserves and buy its currency to pull the rate back. If reserves run low, it may, for example, devalue by resetting the peg to 3.80.
A floating exchange rate is when a currency’s value is mainly set by market supply and demand, rather than being fixed to another currency. The rate moves in response to interest rates, inflation, growth, trade flows, and risk sentiment. Central banks can still influence a floating currency through policy changes or occasional intervention, but they do not guarantee a specific level, as with a peg.
Use: Forex trading, macro analysis, and comparing free-floating currencies with fixed exchange rate regimes.
Example: AUD is a floating currency. If Australia’s rates rise relative to the US and commodity prices climb, demand for AUD can increase, and AUD/USD may rise. If global risk sentiment turns negative, investors may sell AUD, and the pair can fall quickly, even without any change in Australia’s peg (there is none).
Fundamental analysis evaluates an asset’s value by studying its underlying drivers, such as earnings, cash flow, balance sheet strength, growth, competition, and macro factors (rates, inflation, and currency trends). The goal is to estimate intrinsic value and compare it with the market price to determine whether it is undervalued or overvalued. It contrasts with technical analysis, which focuses on price and volume patterns.
Use: Stock investing, credit analysis, long-term forex views, and valuation-based trading.
Example: A company earns $5 per share and trades at $80, a P/E of 16. If peers trade at 22 and the firm is growing faster with lower debt, an analyst may argue fair value is higher, for example $5 × 20 = $100. If risks rise or earnings fall, that valuation thesis weakens.
Geopolitical risk is the chance that political or military events disrupt economies and markets, leading to sudden price movements, volatility, and liquidity issues. It includes wars, sanctions, terrorism, trade restrictions, elections, and regime changes. Geopolitical risk often affects energy prices, safe-haven assets, and currencies tied to global trade.
Use: Macro trading, managing event risk, hedging portfolios, and analysing oil, gold, USD, CHF, and JPY moves.
Example: If a conflict threatens a major oil shipping route, Brent crude might jump from $80 to $92 in a matter of days. Airlines and transport stocks can fall on higher fuel costs, while gold and USD may rise as investors shift into safer assets.
Gross Domestic Product (GDP) is the total value of all final goods and services produced within a country’s borders over a specific period, usually a quarter or a year. It is a broad measure of economic size and growth. GDP can be reported in nominal terms (current prices) or real terms (inflation-adjusted), and as a growth rate relative to the prior period.
Use: Macro analysis, comparing economies, forecasting interest rates, and judging recession risk.
Example: If real GDP grows 0.8% quarter over quarter, annualised about 3.2%, it suggests the economy is expanding. If GDP prints -0.5% for two quarters, markets may expect rate cuts and a weaker currency.
Hawkish describes a central bank or policy stance focused on fighting inflation, even if it slows economic growth. A hawkish central bank is more likely to raise interest rates, keep rates higher for longer, or reduce liquidity (quantitative tightening). Markets often interpret hawkish signals as supportive for the currency and negative for rate-sensitive assets because borrowing costs rise.
Use: Central bank statements (Fed, ECB, BOE), bond yields, FX moves, and inflation expectations.
Example: If the Fed says inflation is still too high and hints at another 0.25% hike, traders may call it hawkish. Treasury yields often rise, and the USD can strengthen as investors price higher short-term rates.
Inflation is a sustained rise in the general price level, meaning your money buys less than before. It is usually measured by indexes like CPI or PCE and reported as a percentage change. Inflation matters for interest rates, wages, bonds, and currencies because central banks often raise rates to slow high inflation and cut rates when inflation is low.
Use: Macro analysis, central bank policy, bond yields, currency moves, and cost-of-living planning.
Example: If inflation is 4% in a year, a $100 basket of goods becomes about $104. If your salary rises only 2%, your real purchasing power falls roughly 2%. If a bond yields 3% while inflation is 4%, the real yield is about -1%, which can push investors toward inflation hedges.
An interest rate is the cost of borrowing money or the return you earn for lending money, expressed as a percentage per unit of time. Central banks set or guide key policy rates, which influence bank lending, mortgage rates, bond yields, and currency values. When rates rise, borrowing usually becomes more expensive, and cash and bonds can offer higher yields. When rates fall, borrowing is cheaper, and risk assets may benefit.
Use: Monetary policy, bond pricing, FX moves, and loan and mortgage costs.
Example: If a bank loan charges 7% per year, borrowing $10,000 costs about $700 in interest annually (ignoring compounding and fees). In forex, if one country raises rates while another holds steady, the higher-yielding currency can strengthen as investors seek better returns, though risk sentiment can override this.
Junk bonds, also called high-yield bonds, are corporate bonds rated below investment grade, meaning they have higher default risk than safer bonds. Because of that risk, they typically pay higher interest rates (yields) to attract investors. Their prices can fluctuate significantly when the economy weakens, credit conditions tighten, or a company’s finances deteriorate.
Use: Income investing with higher risk, credit market analysis, and trading “risk-on” versus “risk-off” sentiment.
Example: If an investment-grade bond yields 4% and a junk bond yields 8%, the extra 4% is compensation for default risk. If recession fears rise, investors may demand 10% instead, pushing junk bond prices down even if the issuer has not missed any payments.
Market sentiment is the overall mood of investors and traders, bullish (optimistic) or bearish (pessimistic), which can influence prices beyond fundamentals in the short term. Sentiment is often inferred from price action, volume, volatility (like VIX), put-call ratios, fund flows, and positioning data. Shifts in sentiment can drive rallies, sell-offs, and sharp reversals, especially around news.
Use: Timing trades, gauging risk-on versus risk-off conditions, and confirming trends in stocks, forex, and crypto.
Example: If major indexes rise steadily while volatility falls and call buying increases, sentiment is bullish. If a surprise inflation print hits and indexes drop 3% in a day while volatility spikes, sentiment flips bearish. A trader may cut leverage, tighten stops, or move into defensive assets until conditions stabilise.
Monetary policy is how a central bank manages interest rates and the money supply to achieve goals such as low inflation and stable growth. It includes setting policy rates, guiding expectations (forward guidance), and using tools such as open market operations, reserve requirements, and quantitative easing or tightening. Tighter policy generally raises borrowing costs and can slow inflation, while easier policy supports lending and spending.
Use: Macro analysis, forecasting bond yields, FX direction, and rate-sensitive stocks.
Example: If inflation is running at 5% and the central bank raises rates from 4% to 5%, mortgages and business loans often reprice higher, cooling demand. Bond yields may rise, and the currency can strengthen as investors seek higher yields. If growth later weakens, the bank may cut rates, which can lift equities but weaken the currency.
NFP (Non-Farm Payrolls) is the monthly US jobs report that estimates how many jobs were added or lost in the economy, excluding farm workers, private household staff, and some government roles. It is released by the Bureau of Labour Statistics and is one of the most market-moving economic indicators.
Use: Forex and index trading, bond yield moves, and expectations for Fed policy (rate cuts or hikes).
Example: If NFP is forecast at +180,000 but prints +320,000 with strong wage growth, markets may price higher rates for longer. USD often strengthens, Treasury yields can jump, and stocks may dip if investors fear tighter policy.
Policy rate is the main interest rate a central bank sets (or targets) to influence borrowing costs, inflation, and economic growth. It acts as the “anchor” for short-term money-market rates, which then affect bank loans, mortgages, bond yields, and, often, the currency. Different countries use different names, such as the federal funds target range, the refinancing rate, or the overnight rate.
Use: Central bank decisions, rate cut or hike expectations, FX, and bond market moves.
Example: If a central bank raises its policy rate from 4.00% to 4.50%, short-term yields often rise, and the currency may strengthen because investors can earn higher interest. At the same time, loan rates increase, which can cool spending and inflation.
Quarterly earnings are a company’s reported financial results for a 3-month period, usually including revenue, expenses, net income, and earnings per share (EPS). Companies release them in earnings reports and often discuss the numbers and future outlook (guidance) on earnings calls. Because expectations are priced in, the surprise versus forecasts often matters more than the raw numbers.
Use: Stock analysis, valuation updates, earnings season trading, and managing event risk and options pricing.
Example: Analysts expect $2.00 EPS and $5.0B revenue. The company reports $2.30 EPS and $5.2B in revenue, and raises next-quarter guidance. Even if the business is stable, a “beat and raise” can trigger an 8% gap-up at the next open.
In trading and finance, a rate is a standardized measure showing how something changes relative to something else, usually expressed as a % per time period (per year, per month) or as a ratio. Common types include interest rates, inflation rates, exchange rates, and rates of return.
Use: Found in central bank decisions, bond yields, loan terms, FX quotes, and performance metrics like annualized return.
Example: If a bond yield is 4% per year, a $10,000 position earns about $400 in interest over 12 months (before taxes and price changes). If the exchange rate is 0.85 EUR per $1, converting $1,000 gives about €850 (ignoring fees).
Trade balance is the difference between a country’s exports and imports over a period, usually a month or a year. If exports exceed imports, it is a trade surplus. If imports exceed exports, it is a trade deficit. Trade balance can influence economic growth and currency demand.
Use: Used in economic reports, FX trading, and macro analysis to judge whether a country is selling more abroad or buying more from abroad.
Example: If a country exports $120B of goods and imports $100B in one month, the trade balance is +$20B (surplus). That can support its currency, as foreign buyers may need to buy local currency to pay for exports.
The unemployment rate is the percentage of the labor force that is unemployed and actively seeking work. “Labor force” means people who are working or trying to work; it does not include people who are not looking (students, retirees, some stay-at-home parents).
Use: Used in economic reports and central bank decisions, it can affect interest rate expectations, stock markets, and currency strength.
Example: If a country has 10,000,000 people in its labor force and 500,000 are unemployed and job-hunting, the unemployment rate is 500,000 ÷ 10,000,000 = 5%. If it rises from 4% to 6%, it can signal a weakening economy.
The US Dollar Index (DXY) tracks the USD’s value against a weighted basket of six major currencies: EUR, JPY, GBP, CAD, SEK, and CHF. When DXY rises, the US dollar is stronger against that basket; when it falls, the US dollar is weaker.
Use: Forex and macro trading, hedging broad USD exposure, and quickly gauging overall US dollar strength.
Example: If DXY moves from 100 to 105 in a month, USD strengthened about 5% versus the basket. That often aligns with EUR/USD moving lower, creating headwinds for USD-priced commodities like gold.
This section covers stock market terminology that adds complexity through leverage, optionality, and structured risk. It includes options and futures concepts, Greeks, implied versus realized volatility, margin mechanics, hedging, spreads, and common ways professionals express risk and exposure.
These terms matter because they describe non-linear outcomes. A small move in the underlying can produce a large change in a derivative’s value, especially near expiration or during volatility shocks. Clear definitions reduce costly mistakes and make it easier to match a strategy to a specific risk limit.
An American option is an option contract that can be exercised at any time up to and including its expiration date. That flexibility makes it generally more valuable than a European option (which can only be exercised at expiration). In practice, many American options are still traded rather than exercised early, because selling often preserves remaining time value.
Use: Listed equity and ETF options (common in the U.S.), early-exercise decisions around dividends, and managing assignment risk.
Example: You own an American call with a $50 strike expiring in 30 days, and the stock jumps to $62. You could exercise now to buy at $50, but if the option still has time value, selling it may yield more than exercising. Early exercise is more common for deep-in-the-money calls right before an ex-dividend date.
Arbitrage is a strategy that aims to profit from price differences for the same (or closely related) asset across markets, with minimal market risk. True “risk-free” arbitrage is rare because fees, speed, and execution limits erase most gaps, so many real-world arbitrage trades include timing, funding, or model risk.
Use: Market making, ETF NAV vs. price trading, futures vs. spot (cash-and-carry), options mispricing, and crypto exchange spreads.
Example: If gold trades at $2,010/oz in spot and an equivalent futures-implied fair price is $2,025 after carry costs, a trader might buy spot and short futures to lock the spread. Profit depends on financing, storage, and execution costs; if they exceed $15, the “arbitrage” disappears.
A call option is an options contract that gives the buyer the right, but not the obligation, to buy an asset at a fixed strike price on or before an expiration date. The buyer pays a premium upfront, and the seller (writer) may be required to sell if the buyer exercises the option.
Use: Used in options trading for bullish bets, hedging, and income strategies like covered calls.
Example: Stock at $100, buy a $105 call expiring in 30 days for $2. Break-even is $107 ($105 + $2). If the stock ends at $112, the option is worth $7, and the profit is $5 after the $2 premium. If it ends at $104, you lose $2.
Carry trade is a strategy where you borrow in a low-interest-rate currency and invest in a higher-interest-rate currency or asset, aiming to earn the interest rate differential (carry) plus any favorable exchange-rate move. In forex, the carry shows up as a daily swap or rollover. The main risk is that the higher-yield currency can fall sharply, wiping out months of interest gains, especially during risk-off shocks when carry trades unwind.
Use: Common in FX (JPY, CHF funding), macro trading, and yield-seeking strategies.
Example: You go long AUD/JPY because AUD rates are 4% higher than JPY. On a $100,000 position, the carry is roughly $4,000 per year before costs. If AUD/JPY drops 5% in a sudden selloff, you lose about $5,000, more than a year of carry.
Carrying cost is the ongoing cost of holding a position. It includes financing or margin interest, storage and insurance for physical commodities, and, in futures or FX, interest-rate differentials (rollover or swap). Carrying costs matter because they reduce net returns and can change which trade setups are profitable, especially for long holding periods.
Use: Used in futures pricing, forex rollover, options, and arbitrage models, and long-term position planning.
Example: You buy $20,000 of stock on margin at an 8% annual interest rate. Holding for 90 days costs about $20,000 × 0.08 × (90/365) ≈ $395. If your trade gains only $300, you’re net negative after carrying cost, even before commissions and spreads.
Cash settlement means a trade or derivative contract is settled by paying the profit or loss in cash, rather than delivering the underlying asset. It is common in index options, many index futures, and some commodity and rate contracts, where physical delivery is impractical. At expiration, the contract is marked to a reference price, and your account is credited or debited for the difference.
Use: Used in options and futures on indexes, volatility products, and some OTC derivatives, affecting expiry risk and planning.
Example: You buy an index call with a 4,000 strike for $50. At expiry, the index is 4,120. Intrinsic value is 120 points. If each point is worth $10, you receive $1,200 cash. Your net profit is $1,200 − $500 premium = $700, no shares exchanged.
Collateral is an asset you pledge to secure a loan or a leveraged trading position. If you cannot repay or your position loses too much, the lender or broker can seize or sell the collateral to cover the debt. In markets, collateral reduces credit risk and enables borrowing, margin trading, and many derivatives and repo transactions.
Use: Common in margin accounts, secured loans, futures and options margin, and institutional funding markets.
Example: You borrow $10,000 on margin to buy stocks and post $12,000 of securities as collateral. If your account equity falls below the broker’s minimum, you may get a margin call. If you don’t add funds, the broker can sell part of your holdings to restore required collateral.
Commodity futures are standardized contracts to buy or sell a specific commodity (such as oil, gold, or wheat) at a set price on a specified future date. They trade on exchanges and are often used for hedging or speculation. Futures use margin, meaning you post a small deposit to control a larger position, which increases both potential gains and losses.
Use: Price hedging for producers and users, short-term commodity trading, and managing exposure to inflation-sensitive assets.
Example: A wheat farmer sells futures at $6.00 per bushel for delivery in 3 months. If cash prices drop to $5.20, the futures gain helps offset the lower selling price, stabilizing income.
Contango is when a commodity’s futures prices are higher for later delivery than for near-term delivery, so the futures curve slopes upward. It often happens when carrying costs like storage, insurance, and financing are meaningful, or when near-term supply is plentiful. In contango, rolling a long position from a cheaper expiring contract into a more expensive later contract creates a negative roll yield, which can drag on returns.
Use: Commodity futures trading, evaluating the forward curve, and understanding commodity ETF performance.
Example: Spot oil is $80. The 1-month future is $81, and the 3-month future is $84. A long oil ETF that sells the $81 contract and buys the $84 contract loses $3 per barrel from the roll, even if spot stays near $80.
Contract size is the standardized amount of an asset covered by one derivatives contract, such as a futures or options contract. It tells you how much exposure you gain per contract, which drives the dollar value of price moves, margin needs, and risk. Contract size varies by product and exchange; for example, an oil future represents a fixed number of barrels, while a stock option typically represents a fixed number of shares.
Use: Position sizing, risk management, and calculating profit and loss in futures and options trading.
Example: If a futures contract is 1,000 barrels and oil rises $2 per barrel, one contract gains $2,000 (1,000 × $2). If your risk limit is $1,000, you might trade half the exposure or use a smaller contract (like a mini) to stay within plan.
Correlation measures how two assets move relative to each other, usually on a scale from -1 to +1. +1 means they move together, 0 means no consistent relationship, and -1 means they move in opposite directions. A correlation matrix is a grid that shows correlations among many assets at once, helping you see diversification and concentration risk in a portfolio.
Use: Portfolio diversification, asset allocation, risk management, and factor exposure analysis.
Example: If US stocks and US bonds have a 0.20 correlation over the past year, they often move somewhat independently, which can reduce volatility. If two tech stocks have a correlation of 0.85, holding both may not add much diversification, even if they are different companies.
A derivative is a financial contract whose value is based on (derived from) another asset, such as a stock, bond, commodity, interest rate, or currency. Common derivatives include options, futures, forwards, and swaps. They are used to hedge risk, gain exposure with less capital, or speculate on price moves. Because derivatives can create leverage, small underlying moves can cause large gains or losses, so margin and risk limits matter.
Use: Hedging portfolios, trading volatility, managing interest rate and FX risk, and institutional risk management.
Example: A wheat futures contract lets you lock in a price for delivery at a later date. If you buy at $6.00 per bushel and the market rises to $6.50, the contract gains $0.50 per bushel (before fees). A farmer might use the opposite position to protect revenue if prices fall.
Expiration is the date and time at which a derivative contract, most commonly an option or futures contract, ceases to be valid. After expiration, an option either expires worthless (if it is out of the money) or is exercised or settled (if it is in the money), depending on the contract rules. Expiration matters because the time value of an option disappears as the deadline approaches, which can accelerate price changes in options.
Use: Options and futures trading, managing time decay (theta), rolling positions, and avoiding unwanted exercise.
Example: You buy a $100 call that expires on June 21. If the stock is $95 at expiration, the call expires worthless, and you lose the premium. If the stock is $110, it is worth about $10 per share at expiration, so you can sell it or exercise it.
A forward contract is a private agreement to buy or sell an asset at a fixed price on a specific future date. In FX, it locks an exchange rate for a future currency conversion, reducing currency risk. Forwards are customizable (amount, date, settlement) and traded over the counter, so they involve counterparty risk.
Use: Corporate FX hedging, locking future cash flows, and commodity price hedging.
Example: A UK company must pay €500,000 in 3 months and fears the EUR will rise versus GBP. It books a EUR/GBP forward at 0.8600, locking a cost of £430,000. If the spot is 0.8900 at payment, it saves £15,000 versus the market rate.
The forward rate is the exchange rate agreed today for exchanging two currencies on a future date, used in a forward contract. It is not a forecast; it is mainly determined by the spot rate and the interest rate difference between the two currencies over the term (covered interest parity). If one currency has higher interest rates, it usually trades at a forward discount versus the lower-rate currency.
Use: FX hedging, pricing forwards and swaps, and evaluating hedged returns on foreign investments.
Example: Spot EUR/USD is 1.1000. 3-month rates are 5% (USD) and 3% (EUR). The 3-month forward is about 1.0946: 1.1000 × (1.03/1.05). A European firm buying USD in 3 months can lock 1.0946 today.
Free margin is the amount of your trading account equity that is still available to open new positions or absorb losses. It is calculated as equity minus used margin (the margin currently locked to support open trades). Free margin changes in real time, along with unrealised profit and loss, are key signals for margin calls and stop-out risk in leveraged trading.
Use: Forex and CFD margin accounts, position sizing, and monitoring margin level.
Example: Your equity is $10,000, and the used margin is $2,500, so the free margin is $7,500. If your open trades reach a $1,200 floating loss, equity drops to $8,800, and free margin becomes $6,300.
Futures roll is the process of closing a futures position in a contract that is nearing expiration and opening a new position in a later-dated contract to maintain exposure. Rolling avoids physical delivery or cash settlement at expiry and is standard for funds and traders who want continuous market exposure. The price difference between contracts creates roll yield, which can be positive or negative depending on whether it is in contango or backwardation.
Use: Commodity and index futures trading, ETF and fund management, and maintaining long-term futures exposure.
Example: You are long 1 crude oil futures at $80 expiring this month. As expiration nears, you sell it and buy next month at $82. You paid $2 more to stay long, a negative roll cost. If next month were $78 instead, the roll would add $2 of positive roll yield.
Gamma exposure (often called GEX) is the options market’s net gamma positioning, commonly estimated for dealers, showing how strongly option deltas will change as the underlying price moves. Gamma is the rate of change of delta, so high gamma exposure can force more delta hedging. If dealers are net long gamma, they tend to buy dips and sell rallies, which can dampen volatility. If they are net short gamma, hedging can amplify moves.
Use: Options flow analysis, volatility forecasting, and index trading (SPX, NDX).
Example: If dealers are short gamma near 5,000 on SPX, a 1% drop can force them to sell futures to re-hedge, pushing prices lower. In a long-gamma regime, the same drop can trigger buying that stabilises the market.
Hedging is reducing or offsetting the risk of an existing position by taking another position that tends to move in the opposite direction. The goal is to limit potential losses, not to maximise profits. Common hedging strategies include options, futures, forwards, or diversification. Hedging can protect against price, interest rate, or currency risk, but it usually has a cost, like option premiums or giving up some upside.
Use: Portfolio risk management, FX protection for foreign assets, and protecting profits before events.
Example: You own 100 shares at $100 and worry about a short-term drop. You buy a 1-month $95 put for $2. If the stock falls to $88, the put gains about $7, offsetting much of the loss. If the stock rises, you keep the upside but lose the $200 premium.
Historical volatility (HV), also called realised volatility, measures how much an asset’s price has fluctuated over a chosen period, usually expressed as an annualised percentage. It is commonly calculated as the annualised standard deviation of daily returns over 10, 20, 30, or 252 trading days. HV describes what happened; it does not predict future volatility.
Use: Options and risk analysis, comparing to implied volatility, setting expectations for moves, and position sizing.
Example: A stock’s 20-day HV is 24%. That implies a typical one-standard-deviation move of about 24% per year, or roughly 24% / √252 ≈ 1.5% per day. If implied volatility is 40%, options are pricing in larger future swings than recent history.
Implied volatility (IV) is the market’s built-in estimate of how much an asset’s price could move in the future, backed out from option prices. Higher IV means options are more expensive because traders are pricing larger potential swings. IV is not a directional forecast and is not guaranteed; it reflects supply and demand for options and expected event risk (earnings, CPI). Comparing IV to historical volatility helps judge whether options look “rich” or “cheap.”
Use: Options pricing, volatility trading, event risk planning, and spotting IV crush.
Example: A stock is $100, and the 1-month at-the-money straddle costs $6. That suggests the market is pricing roughly a ±6% move by expiration. If earnings pass and uncertainty drops, IV can fall, and the straddle may lose value even if the stock barely moves.
Interest rate parity is a forex principle stating that the difference in interest rates between two currencies is reflected in the forward exchange rate, so there is no risk-free profit from borrowing one currency, converting it, investing, and hedging back. Under covered interest rate parity, the hedge uses a forward contract, so the return is locked in.
Use: Pricing FX forwards and swaps, hedging currency exposure, checking for arbitrage.
Example: Spot EUR/USD is 1.1000. 3-month rates are 3% (EUR) and 5% (USD). The 3-month forward is about 1.0946: 1.1000 × (1.0075 ÷ 1.0125). The lower forward reflects higher USD rates.
Leverage is using borrowed money or margin to control a larger position than your cash alone would allow. It amplifies both gains and losses, and it can trigger margin calls if losses reduce your equity too much. Leverage is common in forex, CFDs, futures, and margin stock accounts, so position sizing and stop-loss planning are critical.
Use: Margin trading, futures, and forex accounts, boosting exposure, and managing risk limits.
Example: With $2,000 and 10x leverage, you control a $20,000 position. A 2% move in your favor gains $400 (20% on your cash). A 2% move against you loses $400, and a 10% adverse move would wipe out the $2,000, possibly triggering a stop-out before that.
Liquidity is how easily an asset can be bought or sold quickly without causing a big price change. High liquidity usually means tight bid-ask spreads, deep order books, and low slippage. Low liquidity means wider spreads and bigger price impact, especially for large orders or during volatile news.
Use: Choosing markets to trade, estimating trading costs, setting order types (limit vs market), and managing execution risk.
Example: A major ETF might trade with a $0.01 spread at $100, so entering and exiting costs little. A thin small-cap stock might show a $0.30 spread on $10 and only a few thousand shares available, so a market order can fill much worse than expected and move the price against you.
Maintenance margin is the minimum equity you must keep in a margin account to hold an open position. If your account equity falls below this level due to losses, your broker can issue a margin call, force you to add funds, or liquidate positions. Maintenance margin differs from initial margin, which is the amount required to open the trade. Rules vary by broker and product, and are often higher for volatile assets.
Use: Margin trading in stocks, futures, forex, and CFDs, risk control, and avoiding forced liquidation.
Example: You buy $20,000 of stock on margin, and the broker requires 25% maintenance margin. You must keep at least $5,000 of equity. If the position falls and your equity drops to $4,800, you may receive a margin call and must deposit $200, or the broker may sell shares to restore the margin requirement.
Margin is the money you must set aside in a trading account as collateral to open and maintain a leveraged position. It is not a fee; it is a security deposit that supports potential losses. Initial margin is needed to open the trade, and maintenance margin is the minimum to keep it open. If losses reduce your equity and margin level too much, you can face a margin call or forced liquidation.
Use: Forex, futures, CFDs, and margin stock accounts, position sizing, leverage control.
Example: You have $5,000 and open a $50,000 position using 10x leverage. If the broker requires a 10% margin, the used margin is $5,000, leaving little free margin. A 1% adverse move is a $500 loss, cutting equity to $4,500 and risking a margin call if requirements are breached.
A margin call is a broker’s demand that you add funds or reduce positions because your account equity has fallen below the required maintenance margin. It happens when losses on leveraged trades shrink your free margin and margin level. If you do not act quickly, the broker can liquidate positions automatically to protect its balance from going negative.
Use: Margin trading in stocks, forex, futures, and CFDs, monitoring risk and leverage.
Example: You have $10,000 equity and $6,000 used margin, leaving $4,000 free. A losing trade creates a $3,500 unrealised loss, dropping equity to $6,500 and free margin to $500. If the broker requires at least $1,000 free margin, you receive a margin call. You can deposit $500, close part of the trade, or the broker may close it for you in a fast market.
An option contract is a derivative that gives the buyer the right, but not the obligation, to buy (call) or sell (put) an underlying asset at a fixed strike price on or before an expiration date. The buyer pays a premium, and the seller (writer) takes on the obligation if the buyer exercises. Options are used for hedging, income strategies, or leveraged bets on direction or volatility.
Use: Hedging stocks and portfolios, trading volatility, and creating defined-risk strategies.
Example: A stock is $100. You buy a 1-month $105 call for $2. If the stock ends at $112, the option is worth about $7, so the profit is $5 per share ($500 per contract) minus fees. If the stock stays below $105, the call can expire worthless, and you lose the $200 premium.
A rollover is the act of extending a position to a new settlement date or a new contract, rather than closing it. In forex and CFDs, rollover usually means the overnight financing charge or credit (swap) applied when you hold a position past a daily cutoff. In futures, “rolling” means closing the near-month contract and opening the next-month contract to maintain exposure.
Use: FX/CFD overnight holding costs, futures contract months, and longer-term position maintenance.
Example: You hold a long EUR/USD CFD overnight, and your broker applies a -$3.20 rollover cost for that day. In crude oil futures, you might sell the March contract and buy the May contract before expiry to “roll” the trade forward.
Spread betting is a leveraged way to speculate on price movements without owning the asset. You “bet” a fixed amount per point of movement, and you profit if the market moves in your direction, or lose if it moves against you. Because it uses borrowed exposure (margin), gains and losses can exceed your initial deposit.
Use: Common with brokers offering indices, forex, commodities, and shares, mainly in the UK and Ireland, and often used for short-term trading.
Example: FTSE 100 is 7,500-7,502. You buy at 7,502 for £5 per point. If it rises to 7,522, you make 20 points × £5 = £100 (minus costs). If it drops to 7,482, you lose £100.
Standard deviation is a statistic that shows how widely prices or returns swing around their average. In trading, volatility is commonly measured by standard deviation: a higher standard deviation indicates larger, less predictable moves, while a lower one indicates steadier movement. It is usually calculated from past data, so it describes recent behavior rather than guaranteed future risk.
Use: Used in risk management, position sizing, volatility indicators (like Bollinger Bands), and comparing how risky different assets are.
Example: Two stocks both average a 0.5% daily return. Stock A has a 1% daily standard deviation, and Stock B has a 3% daily standard deviation. B’s typical daily moves are about 3 times larger, so a tight stop-loss is more likely to get hit on Stock B.
Swap rate is the interest rate difference applied when you hold a leveraged position overnight, most commonly in forex and CFDs. It can be a cost or a credit, depending on the two interest rates involved and whether you are long or short. Brokers often call it “swap” or “overnight financing,” and it is usually charged or paid once per day at a set cutoff time.
Use: FX/CFD trading to estimate overnight holding costs, especially for multi-day positions.
Example: You hold a long EUR/USD position overnight, and the swap rate is -$2.50 per day for your size. If you hold it for 4 nights, you pay about $10.00 total (fees and triple-swap days may apply).
An underlying asset is the real thing a derivative is based on; it is what gives the contract its value. The underlying can be a stock, index, currency pair, commodity (e.g., gold or oil), bond, interest rate, or even crypto. Derivatives like options, futures, and CFDs move because the underlying asset’s price changes.
Use: Used in options, futures, CFDs, and structured products to define what you are actually gaining exposure to.
Example: A call option on AAPL has AAPL shares as the underlying asset. If AAPL rises from $180 to $190, that option usually becomes more valuable because the underlying has moved up.
Volatility is how much and how fast a price moves up and down over time. High volatility means bigger, more frequent swings; low volatility means steadier prices. Volatility is not the same as direction; a market can be very volatile while still ending flat. Traders watch it because it affects risk, stop-loss distance, and option prices.
Use: Risk management, position sizing, choosing stop-loss levels, and options pricing (implied volatility).
Example: Stock A usually moves about 1% per day, Stock B often moves 4% per day. With the same stop-loss distance, Stock B is more likely to hit it, so a trader may use a smaller position or a wider stop to control risk.
A volatility index (VIX) is a number that estimates how much a market is expected to swing in the near future, based on option prices. The most famous one is the VIX, often called the “fear gauge,” which reflects expected volatility for the S&P 500 over about the next 30 days. Higher readings indicate traders expect bigger moves; lower readings indicate calmer conditions.
Use: Macro and options trading, risk sentiment (risk-on vs. risk-off), position sizing, and hedging portfolios.
Example: If the VIX rises from 14 to 28, expected volatility roughly doubles, so a trader might reduce position size or widen stop-loss levels. Option premiums also tend to become more expensive when the index is high.
Market participants and entities terminology explains who does what in the market and why different players behave differently. It includes retail investors, institutions, market makers, brokers, exchanges, custodians, clearinghouses, regulators, and the roles each one plays in price discovery and trade settlement.
Knowing these terms improves context. It helps readers understand why liquidity appears and disappears, how large orders are managed, why some venues prioritize speed while others prioritize price improvement, and how rules and oversight support fair and orderly markets.
BoE stands for the Bank of England, the United Kingdom’s central bank. It sets monetary policy, including the Bank Rate (its key interest rate), and uses tools such as bond purchases and sales to influence inflation, employment, and financial stability. BoE decisions strongly affect GBP, UK government bonds (gilts), mortgage rates, and UK equities.
Use: Seen in macro news, forex trading (GBP pairs), bond markets, and interest-rate expectations.
Example: If the BoE raises the Bank Rate from 4.75% to 5.00%, GBP often strengthens because UK yields rise. Gilt prices may fall (yields rise), and rate-sensitive sectors such as real estate can weaken as borrowing costs rise.
BoJ stands for the Bank of Japan, Japan’s central bank. It sets monetary policy to manage inflation and support economic growth, mainly by guiding short-term interest rates and influencing government bond yields. The BoJ has been known for very low rates and bond-buying programs, so its policy shifts can strongly move JPY, Japanese government bonds (JGBs), and global markets through carry trades and risk sentiment.
Use: Tracked in forex (JPY pairs), bond markets (JGB yields), and macro trading.
Example: If the BoJ signals higher rates or allows JGB yields to rise, JPY often strengthens because borrowing in JPY becomes less attractive. That can put pressure on Japanese exporters’ stockpiles, since a stronger JPY reduces overseas profits when converted back into JPY.
A broker is a regulated firm or platform that routes your buy and sell orders to the market and holds your account. Brokers provide access to products such as stocks, ETFs, options, futures, and forex, as well as tools like charts, margin, and reports.
Use: Used whenever you trade or invest, to open accounts, execute orders, and manage cash, margin, and custody.
Example: You place a market buy for 100 shares. Your broker sends the order to an exchange or a market maker, and it's filled near the ask. If the bid is $20.00 and the ask is $20.05, your fill might be around $20.05, plus any fees.
A central bank is a country’s main monetary authority that manages the money system and helps keep inflation and the financial system stable. It typically sets a benchmark interest rate, influences credit conditions, manages currency reserves, and can act as a lender of last resort to banks during crises. Central bank decisions strongly affect borrowing costs, exchange rates, bond yields, and overall market sentiment.
Use: Followed in macroeconomic news, forex, bond markets, and interest-rate expectations.
Example: If inflation runs hot, a central bank may raise rates from 4.00% to 4.50%. Loans and mortgages get pricier, bond yields often rise, and the local currency may strengthen as investors seek higher returns.
The central bank's inflation target is the specific inflation rate it aims for over time, usually measured by a consumer price index (CPI). It guides monetary policy decisions so prices rise slowly and predictably, supporting price stability and sustainable growth. When inflation is above target, policy often tightens; when below target, policy may ease.
Use: Used in central bank communications, interest-rate setting, bond yield expectations, and forex trading.
Example: If a central bank targets 2% CPI inflation but inflation is running at 4%, it may raise its policy rate from 3.50% to 4.00% to cool demand. If inflation later falls to 1%, it may cut rates to stimulate spending.
Central bank minutes are the detailed written record of a central bank’s policy meeting. They summarize the discussion behind the rate decision, including concerns about inflation and growth, differing opinions, vote splits, and clues about what the bank may do next. Minutes can move markets because they often reveal more nuance than the short policy statement.
Use: Followed in macro trading, bonds and rate markets, and forex, to gauge future interest-rate paths and sentiment.
Example: A bank holds rates at 5.00%, but the minutes show that “several members” wanted a hike and that inflation risks remain. Markets may price higher future rates, pushing bond yields up and strengthening the currency.
The central bank rate is the key policy interest rate set by a central bank (like the Fed, BoE, or BoJ). It influences the cost of borrowing and saving across the economy, affecting bank lending rates, bond yields, mortgage rates, and currency values. When the central bank raises the interest rate, loans usually become more expensive, and spending can slow. When it falls, credit often gets cheaper and growth may pick up.
Use: Used in macro analysis, bond and forex trading, and pricing expectations for future rate moves.
Example: If the policy rate is raised from 4.50% to 5.00%, short-term bond yields often rise, and a currency may strengthen as investors seek higher yields. A variable-rate mortgage may also reset to a higher rate.
A counterparty is the other party to a financial trade or contract. If you buy, the counterparty sells, and both rely on each other to meet the contract terms, such as paying cash or delivering assets. Counterparty risk is the chance that the other party defaults, which matters more in over-the-counter (OTC) trades than on exchanges, where clearinghouses reduce this risk.
Use: OTC derivatives, bonds, repos, swaps, and understanding credit risk in trading.
Example: In an interest rate swap between Bank A and Company B, each is the other’s counterparty. If Company B fails, Bank A may lose expected payments and may need to replace the swap at a worse rate. Using a central clearinghouse can lower, not eliminate, this risk.
ECB (European Central Bank) is the central bank for the euro area, responsible for setting monetary policy to maintain price stability and preserve the value of the euro. It steers interest rates and liquidity and oversees major euro area banks through its supervisory role.
Use: Used when discussing EUR moves, euro area inflation, and rate decisions, and bond yield expectations.
Example: If the ECB signals a 0.25% rate hike at its next meeting, markets may push euro-area bond yields higher, and the EUR may strengthen versus currencies with lower expected rates, because investors can earn more yield by holding EUR assets.
An Electronic Communication Network (ECN) is an automated system that matches buy and sell orders directly between market participants (banks, brokers, funds, and traders) without a traditional dealing desk. In forex and some stocks, ECN pricing often shows tight spreads, but you may pay a separate commission, and spreads can widen during news.
Use: Forex brokers, “ECN account” types, scalping, and high-frequency execution.
Example: On an ECN account, EUR/USD might show a 0.2 pip spread, but the broker charges $7 per round turn per standard lot. During a CPI release, the spread could jump to 3–5 pips, and fills may slip, so position sizing and stops matter.
An exchange is an organized marketplace where buyers and sellers trade financial instruments such as stocks, ETFs, futures, options, and crypto. The exchange sets trading rules, provides price quotes, matches orders, and often works with a clearing system to help ensure trades settle properly. Exchanges can be centralized and regulated (like major stock exchanges) or operate differently in crypto.
Use: Placing trades, checking live prices and volume, listing new securities, and ensuring transparent price discovery.
Example: If you buy 100 shares at $25 on an exchange, your broker routes the order into that market’s order book. You might fill at $25.00 or $25.01, depending on liquidity and the bid-ask spread.
FCA usually means the Financial Conduct Authority, the main regulator of financial services firms and markets in the UK. It sets conduct rules, supervises firms, and can fine or restrict companies to protect consumers, support market integrity, and promote competition.
Use: Checking whether a broker or investment firm is UK-authorised, assessing regulatory protections, and interpreting “FCA-regulated” claims.
Example: If a forex broker says it is FCA-authorised, you can search its name on the FCA Register and confirm the permissions match what it offers. If the firm is missing or permissions differ, that is a major red flag.
The Federal Reserve (the Fed) is the central bank of the United States. It sets monetary policy to promote maximum employment and stable prices, and it helps maintain financial system stability. The Fed mainly influences the economy by adjusting the federal funds rate, managing liquidity through open market operations, and communicating policy through the FOMC (Federal Open Market Committee).
Use: Macro analysis, interest rate expectations, bond yields, USD exchange rates, and stock market risk sentiment.
Example: If inflation stays high, the Fed may raise rates by 0.25%. Bond yields often rise, borrowing costs increase, and the USD may strengthen because investors can earn higher yields on USD assets.
A forex broker is a firm that provides a trading platform and access to the foreign exchange market, letting you buy and sell currency pairs like EUR/USD. Brokers quote prices, route your orders (to liquidity providers or internally), charge costs through spreads and sometimes commissions, and may offer leverage and margin. Broker quality depends on regulation, execution speed, slippage, fees, and how client funds are handled.
Use: Opening a forex trading account, placing FX trades, managing margin, and checking regulation and trading costs.
Example: You trade 1 standard lot of EUR/USD (100,000). Broker A shows a 0.8 pip spread with no commission, costing about $8 per trade. Broker B shows a 0.1-pip spread but charges a $7 round-trip, for a total cost of about $8; execution quality can differ in fast markets.
A market maker is a firm that provides liquidity by continuously quoting bid (buy) and ask (sell) prices for an asset. They earn the spread and may also earn exchange rebates, while managing inventory risk as prices move. Market makers help markets trade smoothly by standing ready to buy or sell when others want to trade.
Use: Stock and options markets, ETF trading, and broker execution models (market maker vs ECN/STP).
Example: If a stock is quoted at $49.98 bid and $50.00 ask, the market maker is offering to buy at $49.98 and sell at $50.00. If you send a market buy, you likely fill near $50.00. The market maker then holds short inventory and may hedge by buying shares elsewhere, aiming to keep risk small while capturing the $0.02 spread.
Stock market terminology is the working language behind every quote, order ticket, earnings release, and portfolio report. When investors understand terms like liquidity, bid-ask spread, market capitalization, earnings per share, and free cash flow, they can interpret market information with less confusion and make decisions with greater clarity.
A strong grasp of terminology also reduces avoidable risk. Many costly errors come from mixing up similar concepts, misunderstanding how an order executes, or ignoring how spreads, fees, and volatility affect real returns. Clear definitions make it easier to set entries and exits, size positions appropriately, and compare companies using consistent measures.
Used as a reference, this glossary helps turn unfamiliar market language into practical knowledge. With the terms organized and explained, readers can move faster from reading to understanding, and from understanding to making more consistent investing and trading choices.