Published on: 2025-12-09
Updated on: 2025-12-09
In financial markets, price movements often reveal subtle clues about shifting sentiment, momentum, or uncertainty.
Traders rely on candlestick patterns to interpret these clues, as each candle captures the ongoing battle between buyers and sellers within a given period.
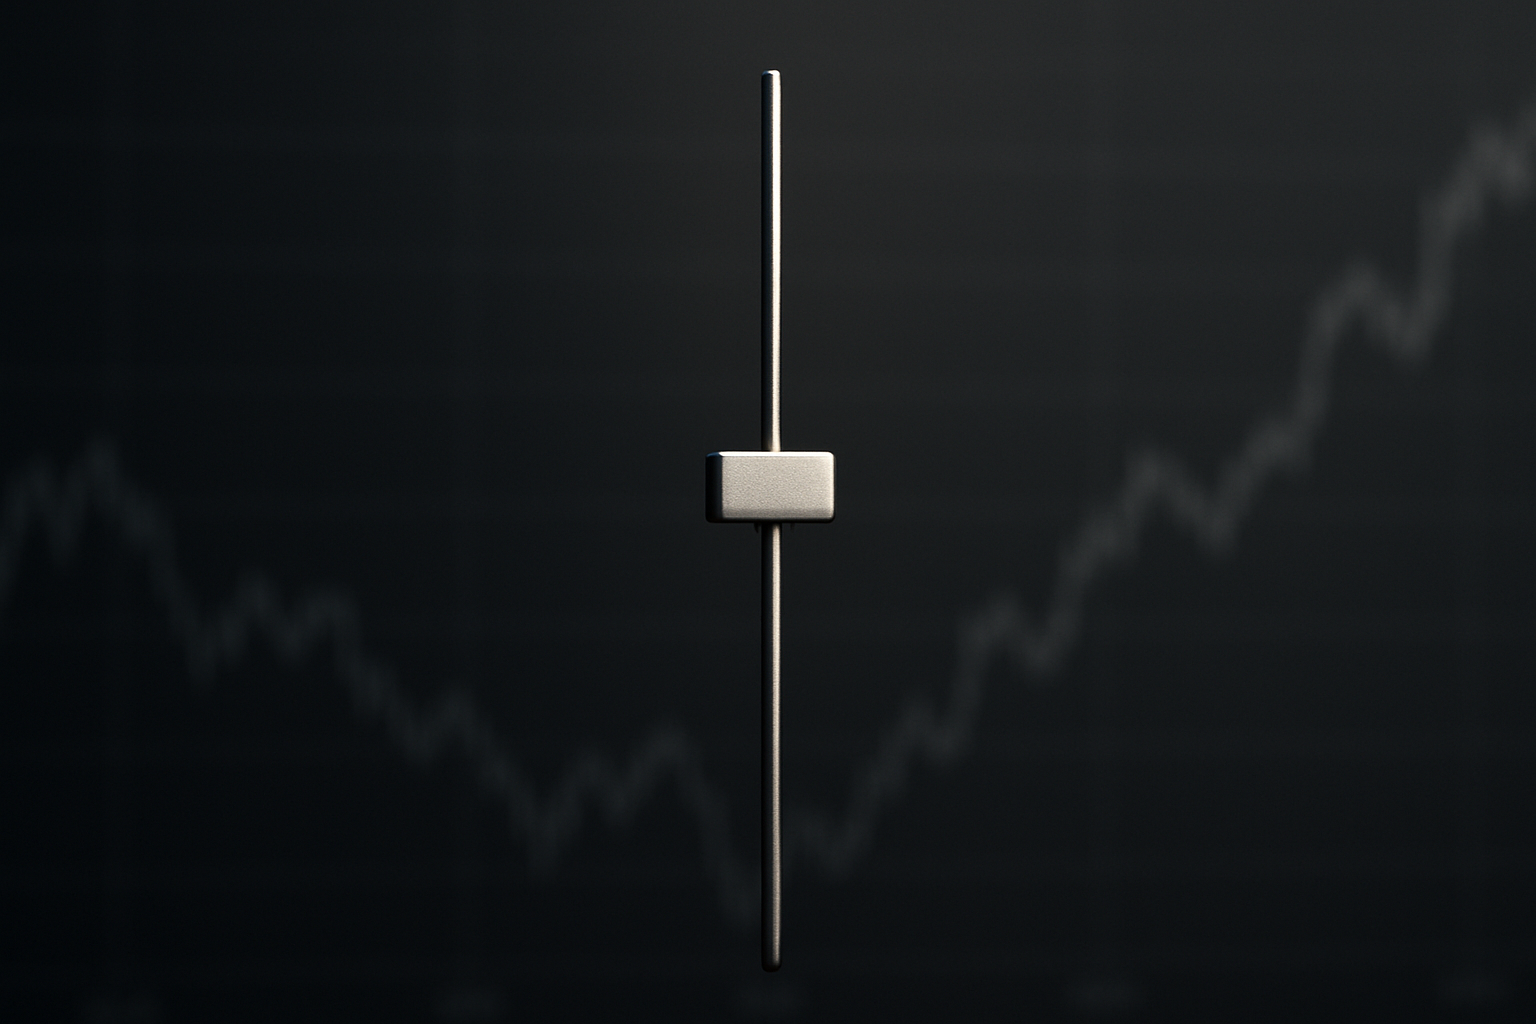
Among these patterns, few are as visually distinctive, or as widely discussed, as the Doji candle. It is one of the simplest yet most insightful formations, offering a snapshot of hesitation or balance in the market.
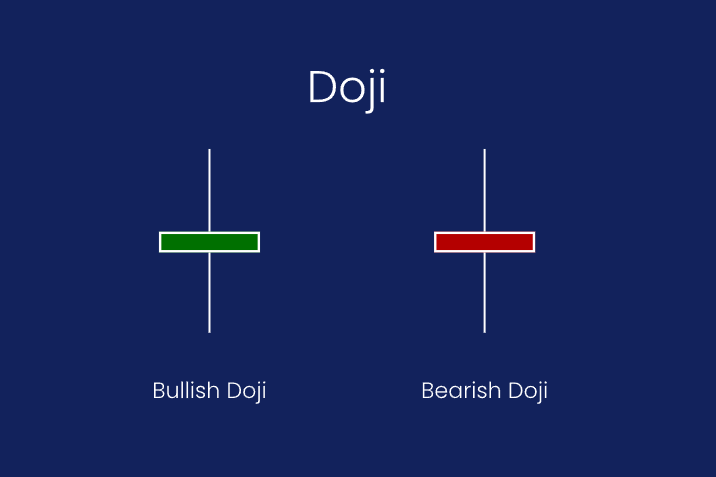
A Doji candle forms when an asset’s opening and closing prices are nearly identical, resulting in a candle with either a very small or nonexistent real body.
Although the shadows (wicks) above and below the candle can vary widely, the defining feature is the equilibrium reflected at the close: buyers and sellers pushed prices in both directions, but neither prevailed by the session’s end.
Traders interpret Dojis as signs of indecision, weakening momentum, or potential turning points, especially when they appear after extended trends or at notable price levels.

At the core of a Doji is its narrow real body. While no candle has perfect precision, a valid Doji typically forms when the open and close prices are within a few ticks of each other. The wicks provide additional clues:
Long upper and lower wicks suggest volatile intraperiod trading but no decisive direction.
A long lower wick (Dragonfly Doji) may signal rejection of lower prices.
A long upper wick (Gravestone Doji) may indicate rejection of higher prices.
A perfectly balanced shape (Long-Legged Doji) often appears during market equilibrium.
The Doji’s visual form compresses sentiment. Buyers and sellers both attempted to push price; neither succeeded by the session’s end.

The classic shape. A thin body with wicks on both sides of similar length.
Interpretation: A pause in movement, signaling hesitation. Its importance increases when it appears after a sharp directional trend.
Long shadows on both ends and a central closing price.
Interpretation: Heightened uncertainty and a sign that the previous trend may be losing strength. Often appears at inflection points.
A candle with a long lower wick and little to no upper wick.
Interpretation: Sellers dominated early but were unable to hold control; buyers forced price back to the open. Seen as potential bullish sentiment if positioned at support.
A candle with a long upper wick and little to no lower wick.
Interpretation: Buyers lifted prices, but sellers overwhelmed them into the close. Often viewed as bearish near resistance or after a sustained rally.
Doji candles are not meant to be traded in isolation. Instead, they act as contextual clues within price action analysis.
A Doji appearing after a prolonged bullish or bearish move may warn that the momentum is fading. However, you should typically wait for confirmation from subsequent candles, such as:
A strong bullish candle after a Dragonfly Doji in a downtrend
A bearish engulfing pattern after a Gravestone Doji near resistance
In consolidating markets, Doji candles simply confirm existing indecision, helping traders anticipate breakouts or extended ranges.
If a Doji forms near a historical price level, its message strengthens, suggesting the market is debating whether to break through or bounce.
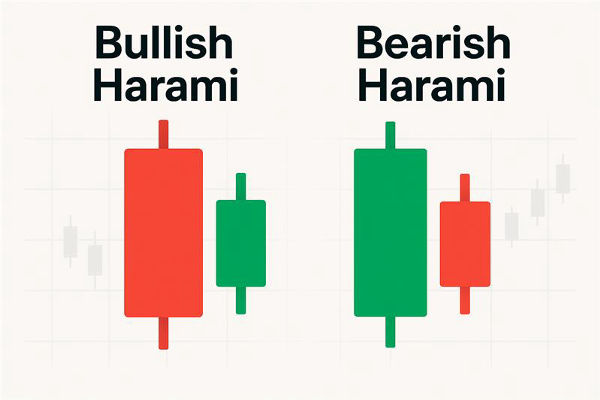
Doji candles are integral components of more complex setups such as:
Morning/Evening Doji Star
Tri-Star
Abandoned Baby
These patterns enhance the Doji's meaning by embedding it within broader market behavior.

Imagine an asset that has rallied for several days, forming a series of strong green candles. As price reaches a known resistance zone, a Gravestone Doji appears.
During that session, buyers pushed price significantly higher, but sellers ultimately drove it back to the opening level, leaving a long upper wick.
This example illustrates how a Doji signals hesitation rather than offering a standalone entry or exit command.
While Doji candles are visually striking and conceptually intuitive, traders must approach them with caution:
A Doji is not automatically a reversal. Context determines meaning.
Frequent Dojis in a range have low predictive value. They simply reflect balanced trading.
Low liquidity can create misleading Dojis. Illiquid sessions may distort candlestick significance.
Volatility influences wick length. Long wicks may reflect random intraperiod noise rather than sentiment rejection.
Candlestick Pattern: A charting format that displays price behavior within a given period using open, high, low, and close levels.
Reversal Pattern: A chart formation suggesting that the prevailing trend may change direction.
Support: A price level where buying interest historically prevents further decline.
Resistance: A price level where selling interest historically halts upward movement.
No. A Doji can precede either a reversal or continuation depending on trend strength, volume, and the candles that follow. Confirmation is crucial.
There is no universal minimum, but generally they must be nearly equal, visually producing a thin or nonexistent body. Traders use discretion based on the asset's volatility.
They still provide information, but volatility increases noise. Long wicks may reflect random fluctuations rather than decisive sentiment shifts.
Higher timeframes, such as 4H, daily, or weekly, tend to produce signals with more significance. Lower timeframes may generate many Dojis with little predictive power.
High volume during a Doji strengthens its message of indecision and potential change. Low volume often weakens its validity.
A Doji candle is a candlestick pattern defined by nearly equal opening and closing prices, representing market indecision.
It can occur in any trend and takes on meaning only when interpreted in context with surrounding price action, volume, and key levels. While Dojis often appear before trend shifts, they are not inherently predictive; traders rely on confirmation and broader analysis.
Understanding the different forms helps traders read market sentiment with greater nuance.
Disclaimer: This material is for general information purposes only and is not intended as (and should not be considered to be) financial, investment or other advice on which reliance should be placed. No opinion given in the material constitutes a recommendation by EBC or the author that any particular investment, security, transaction or investment strategy is suitable for any specific person.


World's Best Broker