Published on: 2025-12-09
Updated on: 2025-12-09
Divergence in trading is one of the most reliable early-warning signals that helps traders identify potential trend reversals with greater confidence.
At its core, divergence is a study of momentum. When the price reaches a new high or low but the indicator fails to confirm this movement, it suggests that buying or selling strength is fading.
Traders often use divergence in combination with trend analysis, candlestick structure, and support or resistance levels to improve decision making.
Divergence in trading refers to a situation in which the price of a financial instrument moves in one direction while a technical indicator moves in another.
This disagreement between price action and indicator behavior often signals that the current trend may be weakening.
Divergence is used across forex, stocks, commodities, and index markets, and is particularly valued because it can alert traders to a possible shift before it becomes visible on the chart.
Imagine two people walking up a hill together. One keeps marching, trying to reach the top, but the other slowly starts dragging behind.
From a distance it still looks like they are going uphill at the same pace, but if you look closely, you see the momentum is no longer shared.
Divergence works the same way in markets: price seems to climb or fall, but the indicator reveals that the force pushing it is weakening. That quiet disconnect is often the first sign that direction may be about to change.
Divergence occurs because momentum indicators such as RSI, MACD, or stochastic oscillators measure the speed and strength of price movements rather than price itself.
When momentum slows while price continues to extend, the indicator begins to create different peaks or troughs than the price chart. This difference can highlight exhaustion in the prevailing move.

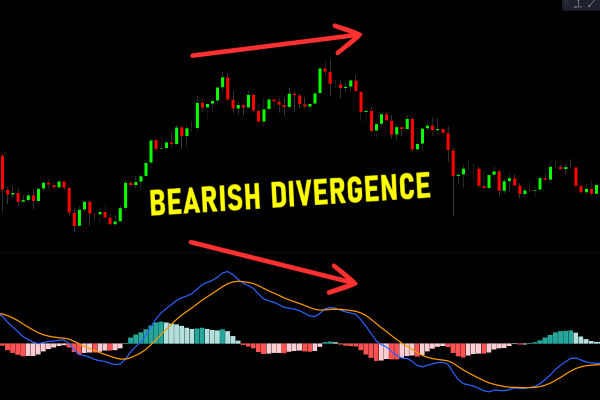
For example, if a currency pair prints a higher high during an uptrend but the RSI forms a lower high, then, the momentum is no longer supporting the uptrend.
The weakening strength often precedes a pullback or full reversal. This relationship is why divergence is considered a leading signal rather than a lagging one.
Divergence tends to form in environments where momentum changes more quickly than price:
End of strong trends: As buyers or sellers tire, indicators lag behind.
During corrections: Hidden divergence often appears while price temporarily moves against the main trend.
Near major support or resistance zones: Momentum begins to shift even if price temporarily breaks levels.
During news-driven spikes: Sharp moves can overextend price, revealing short-lived divergences.
There are two primary forms of divergence that traders study.
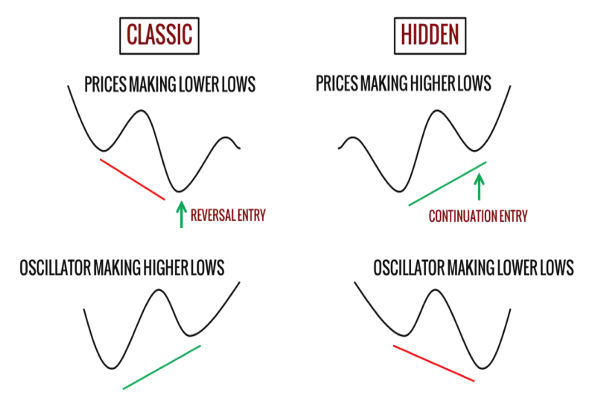
Regular divergence signals a potential trend reversal. If the price makes a higher high but the indicator makes a lower high, it suggests selling pressure is increasing even though price continues upward.
This is known as bearish regular divergence. Conversely, if price makes a lower low but the indicator forms a higher low, it is bullish regular divergence, hinting that the downtrend may lose strength.
Hidden divergence signals potential trend continuation. It often appears during corrective movements within a strong trend. If price makes a higher low while the indicator forms a lower low, it suggests bullish continuation.
If the price makes a lower high while the indicator forms a higher high, it suggests bearish continuation. Hidden divergence helps traders stay aligned with dominant market direction.
Divergence can shape the way you approach a trade. A bearish divergence may stop you from buying too late in an uptrend.
A bullish divergence may help you avoid shorting into a weakening downtrend. It influences exit timing as well: divergence during a position often signals that the move is losing steam, prompting traders to tighten stops, scale out, or take profit.
Spreads and direct transaction costs do not change because of divergence, but risk does.
Divergence warns that the trend may be fragile, so breakouts become less reliable and reversals more likely. That means traders need to adjust position size or entry timing when divergence is present.
Divergence appears after clean, well-defined swings in a trend.
Price approaches a strong level where a reversal is plausible.
Indicator and price both show symmetric, readable patterns.
Divergence appears in noisy sideways markets.
Indicator swings are unclear or lag heavily.
The trader treats divergence as a guaranteed reversal instead of a warning.
Imagine GBP/USD climbs from 1.2500 to 1.2700, then pushes slightly higher to 1.2730. On the chart this looks like continued strength. But your RSI shows something different: at 1.2700 RSI peaked at 68, and at 1.2730 it peaks only at 60.

Price made a higher high; momentum made a lower high. That is bearish divergence.
If you buy at 1.2730 believing the uptrend will continue, you might be caught when GBP/USD drops back toward 1.2650. But if you see the divergence beforehand, you may wait for a pullback or skip the trade entirely.
The central insight: price tried to push, but the force behind it weakened.
Traders apply divergence primarily with oscillators because these tools naturally express momentum.
RSI is one of the most widely used because its structure makes divergences easy to recognize.
MACD (Moving Average Convergence/Divergence) also provides clear momentum shifts through its histogram and signal line interaction.
Stochastic oscillators offer similar insight, particularly during overbought or oversold market conditions.
While these indicators differ in formula, they serve the same function in divergence analysis. They help traders detect when momentum trends diverge from price trends. This comparison strengthens pattern recognition and encourages disciplined market interpretation.
Open your chart and look at the price swing structure.
Compare highs and lows in the indicator to the highs and lows in price.
A normal, healthy trend shows indicators and price moving together.
A risky condition shows price making new extremes while the indicator does not confirm.
Check multiple timeframes to filter out noise.
Review divergence especially before entering at trend extremes.
Tip: Check for divergence every time you prepare a trade near a major support or resistance zone.
Trend Reversal: A trend reversal occurs when the prevailing market direction shifts from upward to downward or vice versa, signaling a change in overall price momentum.
Momentum Indicator: A momentum indicator measures the speed and strength of price movements to help traders evaluate whether a trend is gaining or losing force.
Price Action: Price action refers to the study of raw market movement without relying heavily on indicators, focusing instead on patterns, structure, and candlestick behavior.
Divergence indicates that the momentum behind the price movement is weakening. This weakening can lead to a trend reversal or a trend continuation depending on whether the divergence is regular or hidden.
Divergence is a respected tool, but it is not infallible. Traders typically combine it with support and resistance analysis, trend assessment, or confirmation indicators to improve reliability.
RSI is commonly used because of its clear swing points, but MACD and stochastic oscillators are also effective. The best choice depends on the trader’s analytical style.
Divergence is a critical concept in trading because it highlights imbalance between price and momentum. When used with disciplined technical analysis, divergence can alert traders to potential reversals and help validate trend continuation patterns.
Understanding its structure, recognizing its signals, and integrating it with broader market context allows both new and developing traders to build stronger analytical skills.
Disclaimer: This material is for general information purposes only and is not intended as (and should not be considered to be) financial, investment or other advice on which reliance should be placed. No opinion given in the material constitutes a recommendation by EBC or the author that any particular investment, security, transaction or investment strategy is suitable for any specific person.


World's Best Broker