Published on: 2023-12-15
Updated on: 2026-04-29
Trend analysis helps traders and investors separate real market direction from short-term noise. In forex, stocks, commodities, and indices, most poor decisions begin when traders mistake a temporary bounce for a trend or treat volatility as confirmation.

At its best, trend analysis shows whether buyers or sellers control the market, how strong the movement is, and what price level would invalidate the view.
Trend analysis identifies whether a market is rising, falling, or moving sideways.
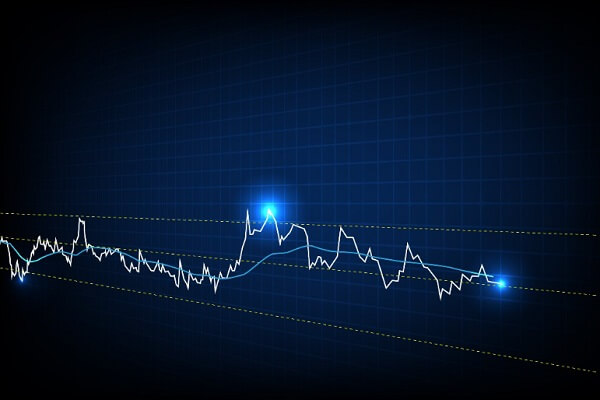
A strong uptrend forms higher highs and higher lows. A downtrend forms lower highs and lower lows.
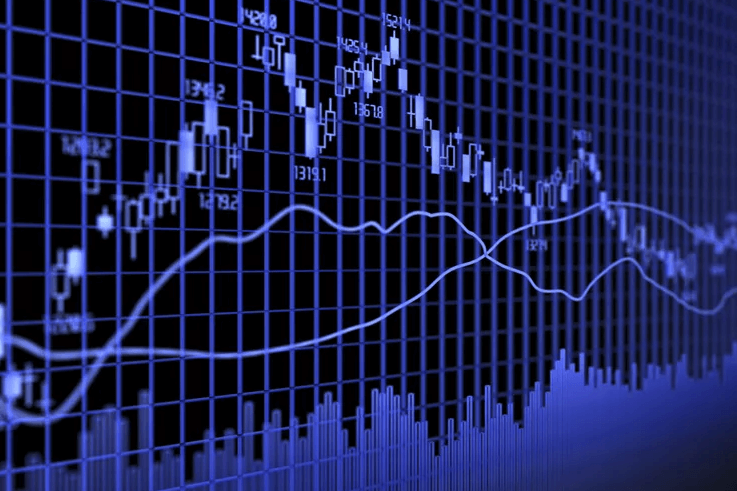
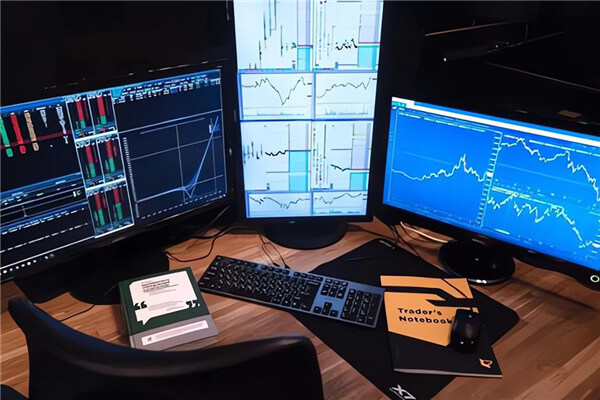
Moving averages, RSI, MACD, trendlines, support, and resistance are core trend analysis techniques.
A trend is strongest when price structure, momentum, volume, and macro drivers all point in the same direction.
Good trend analysis always defines the invalidation level before any trade or investment decision.
Trend analysis is the process of studying historical data to identify the direction, strength, and possible continuation of a trend. In finance, it can apply to market prices, revenue, earnings, margins, debt, inflation, interest rates, or investor sentiment.
A trend usually falls into one of three categories:
The purpose of trend analysis is not to predict every market move. Its purpose is to improve probability. It helps readers answer three practical questions: what is the direction, how strong is the trend, and where is the view wrong?
Before making a trading or investment decision, use a simple four-step framework.
If three of the four answers point in the same direction, the trend is more strongly confirmed. If the answers conflict, the market may be range-bound, exhausted, or vulnerable to a false breakout.

The first step is to define the asset and time frame. A forex trader may analyse EUR/USD or USD/JPY. An equity investor may study the S&P 500, Nvidia, Apple, or a sector ETF. A commodity trader may focus on gold, crude oil, copper, or silver.
The time frame must match the objective. Day traders often use 15-minute or hourly charts. Swing traders focus on 4-hour and daily charts. Long-term investors rely more on weekly and monthly charts.
The larger time frame should guide the main bias. The smaller time frame should help with timing.
Market structure is the foundation of price trend analysis. In an uptrend, price repeatedly forms higher highs and higher lows. In a downtrend, price forms lower highs and lower lows. In a range, the price fails to break above resistance or below support.
For example, if gold breaks to a new high, pulls back, and then holds above the previous swing low, buyers still control the structure. A break below that swing low would not automatically start a bear market, but it would weaken the bullish setup and require fresh confirmation.
Gold’s 2025 rally showed why market structure matters. Prices surged to record highs as safe-haven demand, central-bank buying, and dollar weakness supported the broader trend. The World Bank said gold briefly exceeded $4,300 per ounce in October 2025 and projected fresh highs in 2026.
Support is an area where buyers have previously entered. Resistance is an area where sellers have a capped price. Trendlines help connect important swing lows in an uptrend or swing highs in a downtrend.
These levels should be treated as zones, not exact prices. Markets often pierce a level during news events before reversing. A cleaner signal usually comes from a candle close, volume expansion, or a successful retest.
Moving averages smooth price action and help confirm direction.
If price trades above the 50-day and 200-day moving averages, the broader trend is usually positive. If price trades below both, sellers have stronger control. Moving averages are most useful in trending markets. They become less reliable when the price moves sideways.
Once the market structure is clear, indicators can show whether the trend has enough strength to continue.
RSI measures momentum. A reading above 70 may show strong buying, but it can also warn that the market is stretched. A reading below 30 may show heavy selling, but it does not guarantee an immediate reversal.
MACD helps identify momentum shifts. A bullish crossover supports upside pressure. A bearish crossover signals weakening momentum.
The strongest trend signals appear when price and momentum agree. If price makes a new high while RSI makes a lower high, momentum divergence may warn that buyers are losing strength.
Charts show what the market is doing. Fundamentals help explain why it is happening.
In forex, trend analysis often depends on interest-rate expectations and yield spreads. In equities, earnings, valuations, sector leadership, and market breadth matter. In commodities, supply shocks, demand trends, geopolitics, and currency movements can dominate price action.
This is especially important when index performance hides weak participation. Recent market breadth data showed that about 53% of S&P 500 stocks were trading above their 50-day moving averages, suggesting that large-cap technology stocks were driving much of the rally.
Trend analysis is not limited to charts. It is also useful for financial statements, revenue growth, profit margins, cash flow, and balance-sheet data.
The basic formula for trend analysis is:
Trend percentage = Current value ÷ Base value × 100
Example:
A trend index of 138 means revenue increased 38% from the base year. This method helps investors see whether a company is improving consistently or relying on one strong period.
For market prices, the same logic applies. If a stock rises from $80 to $100, the gain is 25%. If price rises while volume falls, the trend may need stronger confirmation.

Technical analysis uses charts, patterns, moving averages, RSI, MACD, Bollinger Bands, support, and resistance. It is best for timing entries, exits, and invalidation levels.
Fundamental analysis studies interest rates, inflation, earnings, valuation, economic growth, and industry trends. It explains why a trend may continue or fail.
Quantitative analysis uses statistics, historical data, volatility models, and rules-based systems. It helps test whether a trend strategy has worked across different markets.
Event-driven analysis focuses on central-bank decisions, earnings, employment data, elections, tariffs, wars, and supply shocks. These events can accelerate or reverse an existing trend.
Many traders identify trends too late, after most of the move has already happened. Others rely on one indicator without checking the price structure.
The most common mistakes include:
Treating every breakout as confirmation.
Ignoring the higher time frame.
Buying after momentum has already weakened.
Using exact support and resistance prices instead of zones.
Forgetting that news can invalidate technical signals.
Good trend analysis does not create certainty. It improves discipline and probability.
Trend analysis helps traders avoid emotional decisions. It provides a structured way to understand direction, evaluate strength, and manage risk.
Its limitation is that trends can fail. Indicators lag. False breakouts are common. A strong chart can reverse quickly if inflation data, central bank guidance, or earnings results shift the market narrative.
The best use of trend analysis is not blind trend-following. It is evidence gathering.
Trend analysis is used to identify direction, measure momentum, compare financial performance, and support trading or investment decisions. It helps investors understand whether an asset is rising, falling, or consolidating.
Choose the market and time frame, identify structure, draw trendlines, mark support and resistance, use moving averages, check momentum, and confirm the trend with volume or fundamentals.
The three main trend types are uptrend, downtrend, and sideways trend. Traders may also classify trends by duration, such as major, secondary, and short-term trends.
Divide the current value by the base-period value and multiply by 100. This creates a trend index that shows how much the value has changed from the starting period.
Trend analysis is useful but not perfect. It works best when the price structure, momentum, volume, and fundamentals all point in the same direction. It becomes weaker during sudden news shocks or range-bound markets.
Trend analysis gives traders and investors a structured way to read market direction. Its value lies in discipline, not prediction.
A trend is strongest when price structure, momentum, volume, and fundamentals confirm the same view. No indicator should stand alone. The best trend analysis identifies where the market is moving and, more importantly, where that view becomes wrong.
Disclaimer: This material is for general information purposes only and is not intended as (and should not be considered to be) financial, investment or other advice on which reliance should be placed. No opinion given in the material constitutes a recommendation by EBC or the author that any particular investment, security, transaction or investment strategy is suitable for any specific person.