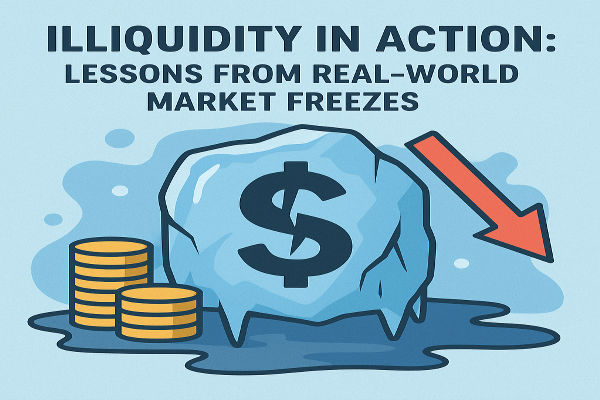
Liquidity keeps markets alive. It is the invisible current that lets trades flow smoothly, like water running through a river. When that current dries up, the market’s surface looks calm, but underneath it, panic brews. Orders fail to fill, prices gap unexpectedly, and volatility spirals. This is the reality of illiquidity, the silent force that can turn opportunity into chaos in seconds.
Illiquidity occurs when buyers and sellers disappear, and it becomes difficult or impossible to trade at stable prices. It does not just affect small, obscure markets. Even the world’s most traded assets can freeze when fear or uncertainty strikes. To understand why, we must look at how liquidity forms, how it vanishes, and what lessons history has taught traders about surviving such moments.
What Is Illiquidity?
Illiquidity refers to the lack of sufficient market participants willing to trade an asset at or near the current price. In simple terms, it means there are not enough buyers or sellers, so transactions either take longer to complete or move prices sharply.
A liquid market is one where you can buy or sell quickly with minimal price change. The foreign exchange market, for instance, is among the most liquid in the world, with over 7.5 trillion US dollars traded daily according to the Bank for International Settlements. In contrast, an illiquid market might see only a handful of trades each day, such as niche corporate bonds, small-cap stocks, or certain commodities during off-hours.
Illiquidity increases costs through wider spreads, higher slippage, and slower execution. It can also distort technical patterns and lead to false price signals that confuse traders who rely on chart analysis.
Why Illiquidity Matters to Traders
For traders, illiquidity represents risk beyond simple price movement. Even if the market direction is correct, the inability to enter or exit efficiently can turn a profitable trade into a loss. During thin trading hours or sudden news events, the absence of liquidity providers can trigger violent swings.
The most critical problem is execution risk. Traders can find themselves trapped in a position because there is no matching counterparty. In leveraged trading, that delay can lead to margin calls or forced liquidations. In some cases, stop-loss orders may trigger at far worse levels than intended because spreads widen dramatically.
During extreme events, spreads can expand five to ten times their usual range. For instance, in flash crashes, where automated systems withdraw orders simultaneously, liquidity can evaporate in seconds, leaving even professional traders powerless.
Real-World Examples
Real-World Example 1: The 2008 Global Financial Crisis
The global financial crisis remains the most dramatic example of systemic illiquidity. As mortgage-backed securities lost value, investors stopped trading them entirely. Banks could not sell or price the assets on their books because there were no willing buyers. This created a chain reaction, freezing credit across the system.
The problem was not that these assets were worthless, but that no one trusted their true value. Illiquidity became a proxy for fear. Governments and central banks were forced to intervene, injecting trillions of dollars to restore confidence. This episode revealed a fundamental truth: liquidity is not guaranteed by asset quality alone, but by trust in the market’s ability to function.
Real-World Example 2: The 2020 Oil Market Collapse
In April 2020, the West Texas Intermediate (WTI) crude oil futures market did the unthinkable. Prices fell below zero, hitting negative 37 US dollars per barrel. Traders who held long positions before contract expiry were desperate to exit because they could not take physical delivery.
The normal buyers, such as refineries and storage operators, had no capacity left due to a demand collapse during the pandemic. Liquidity vanished. The few remaining buyers demanded traders pay them to take contracts off their hands. This was not just a price anomaly, but a perfect case study of how illiquidity amplifies crisis when logistics, leverage, and panic collide.
Real-World Example 3: March 2020 Bond and ETF Freeze
Another striking episode came from bond markets in March 2020. As investors rushed to cash during the pandemic shock, even highly rated corporate bonds stopped trading. The iShares iBoxx $ Investment Grade Corporate Bond ETF (LQD), one of the largest bond ETFs in the world, traded at discounts of up to 5 percent below its net asset value.
The problem was that the underlying bonds were illiquid, while the ETF units still traded continuously. The result was a temporary disconnection between real asset values and their tradable instruments. It was only after the US Federal Reserve intervened with bond-buying programmes that liquidity normalised.
The Mechanics Behind Illiquidity
Several factors can cause liquidity to vanish, often interacting in dangerous ways:
Market Depth
When few orders exist on either side of the book, even small trades move prices substantially.
Bid-Ask Spread
The difference between buy and sell prices widens when market makers withdraw.
Volatility Feedback
Rising volatility makes traders and institutions pull orders, further reducing liquidity.
Leverage Pressure
Highly leveraged funds are forced to sell assets, worsening the liquidity spiral.
Confidence Shock
When participants lose trust in pricing accuracy, they stop trading altogether.
How to Identify Illiquidity Early
Recognising the early signs of illiquidity helps traders protect capital before conditions worsen. Some practical indicators include:
Sudden widening of bid-ask spreads across major pairs or assets
Reduced trading volume during typically active sessions
Irregular price gaps or slippage when placing market orders
Delayed order execution or partial fills on platforms
Rising volatility indices such as the VIX or MOVE, which reflect uncertainty in derivatives pricing
By monitoring these signals, traders can adjust strategies, reduce leverage, or shift to more liquid instruments.
Managing Liquidity Risk
Illiquidity cannot always be avoided, but its effects can be managed through preparation and discipline:
Use Limit Orders: Avoid market orders in thin conditions to control entry price.
Diversify Exposure: Spread trades across different assets and markets.
Reduce Leverage: Smaller positions reduce the risk of liquidation during wide spreads.
Stay Informed: Major policy events, economic data, or geopolitical shocks can instantly drain liquidity.
Hold Adequate Margin: Maintain sufficient capital buffer to survive temporary volatility.
Even large institutions follow these principles, relying on liquidity risk models that simulate worst-case withdrawal scenarios.
The Modern Liquidity Landscape in 2025
In 2025, markets remain fast, connected, and algorithm-driven, but not immune to liquidity shocks. High-frequency traders provide much of the day-to-day liquidity, yet they often withdraw simultaneously during stress events.
Regulators have introduced circuit breakers and mandatory clearing mechanisms to reduce contagion, yet flash events still occur. A recent IMF report shows that average bid-ask spreads across developed equity markets have narrowed by 35 percent compared with pre-2010 levels, but that improvement can reverse instantly in panic conditions.
In crypto and decentralised finance, illiquidity is also a major concern. Thin liquidity pools and automated market makers can exaggerate slippage during sell-offs. The collapse of several altcoins in 2024 demonstrated that digital markets face the same vulnerabilities as traditional finance, only faster.
FAQs About Illiquidity in Action
Q1. Can major financial markets become illiquid?
Yes. Even markets like oil, US Treasuries, or global equities can freeze temporarily when volatility or uncertainty surges.
Q2. Which assets are most prone to illiquidity?
Small-cap stocks, corporate bonds, real estate, and niche commodities are particularly vulnerable due to fewer participants.
Q3. How can retail traders protect themselves?
By monitoring spreads, trading during peak market hours, and keeping leverage conservative to avoid forced exits when liquidity disappears.
The Big Picture
Illiquidity is the quiet enemy of every trader. It hides behind calm markets, waiting for moments of stress to expose weaknesses in execution, strategy, and confidence. Every major financial crisis in modern history has involved a sudden loss of liquidity.
Traders who understand this risk learn that liquidity is not permanent. It must be earned through stable participation, transparency, and trust. In a world where algorithms and humans coexist, the ability to recognise when the market’s heartbeat slows remains one of the most valuable skills a trader can have.
Mini Glossary
Liquidity: The ease with which an asset can be traded quickly at a stable price.
Illiquidity: A market condition where trading is difficult or delayed due to lack of buyers or sellers.
Bid-Ask Spread: The gap between the price buyers are willing to pay and the price sellers demand.
Market Depth: The number of buy and sell orders available at each price level.
Slippage: The difference between the expected and actual price of a trade.
Disclaimer: This material is for general information purposes only and is not intended as (and should not be considered to be) financial, investment or other advice on which reliance should be placed. No opinion given in the material constitutes a recommendation by EBC or the author that any particular investment, security, transaction or investment strategy is suitable for any specific person.
