Published on: 2025-12-10
Updated on: 2025-12-10
Order blocks are special price zones on a chart where large players, such as banks and funds, placed big orders in the past.
These zones often caused a strong move in price, up or down. When price comes back to the same area later, it often reacts again, because there may still be interest to buy or sell there. In simple words, order blocks show where “smart money” did business and may do it again.
For real traders, this matters because these zones can act like strong support or resistance and can give clear places for entries, exits, and stop loss levels.
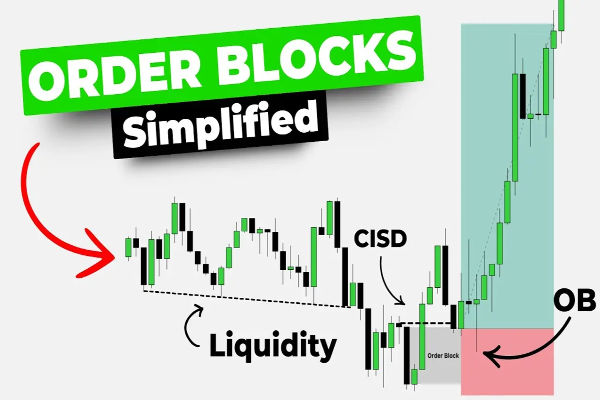
An order block is a price area on the chart where large institutional traders placed many buy or sell orders, often shown by a short period of tight trading followed by a strong move in one direction. These clusters of orders create high liquidity and often act as important support or resistance zones.
Many “smart money concepts” traders define an order block more tightly as the last opposite candle (for example a bearish candle before a big bullish move) that caused a clear break of structure. This candle and its small range form the core of the order block area.
.png")
Traders mark that zone and wait for price to return, looking for a reaction such as a bounce, rejection, or reversal pattern.
Order blocks are watched most by price action traders, smart money concepts traders, and those who focus on institutional order flow in forex, indices, and crypto.
Imagine a wholesaler who buys fruit in huge amounts each week. The seller knows the buyer always purchases crates at a certain price range. If the price rises a bit, the buyer waits. If the price falls back into the familiar range, the buyer returns and buys heavily.
This creates a “memory zone” in the market.
Every time prices dip into that range, demand jumps again because the large buyer steps in. Order blocks work the same way on a chart. Big players placed major orders in a certain zone.
When price comes back to that zone, the market can react sharply because similar interest may appear again.
Institutions split their orders into smaller pieces. This creates repeated activity in a specific price region.
Banks use these areas to fill positions. When they enter trades around these zones, the candles form a clear structure on the chart.
Order blocks often appear before strong breakouts because major participants accumulate or distribute positions.
.png")
1. Bullish Order Block
A bullish order block forms when price is moving down, stalls in a tight zone, then reverses upward strongly. The zone shows where buyers absorbed all selling pressure.
A bearish order block forms when price climbs, pauses within a tight zone and then reverses downward. It signals heavy selling interest.
Sometimes order blocks appear within a trend. They build momentum for the next move rather than reversing direction.
.png")
| Check | Real Order Block | Not an Order Block |
|---|---|---|
| 1. Strength of move after zone | Price shoots away fast | Price drifts slowly with weak momentum |
| 2. Candle selection | Last opposite candle before a big move | Random cluster of candles with no clear pattern |
| 3. Break of structure (BOS) | Creates a new high or low | No meaningful structural change after price leaves zone |
| 4. Retests | Tested once or twice at most | Retested many times; supply or demand already consumed |
| 5. Trend alignment | Aligns with higher timeframe trend | Goes against the main trend; low probability setup |
Look for the last candle or small cluster before a strong move.
Use the candle body or the whole range, depending on the style.
Order blocks work best on retests, not on the initial breakout.
Wicks, rejection candles, or momentum shifts help verify interest.
Blocks aligned with the trend have higher probability.
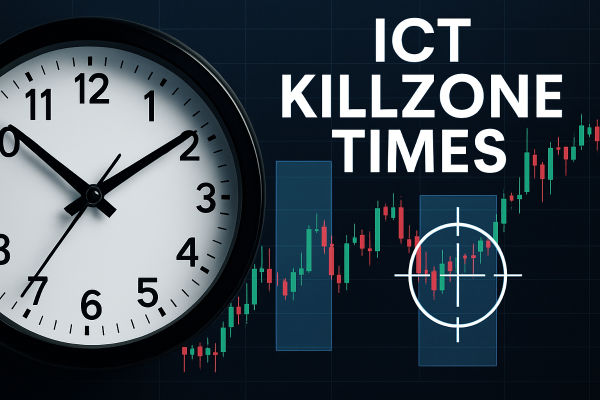
Recheck blocks at the start of each session. Price may approach them faster than expected during active hours.
Imagine EUR/USD is falling and forms a bullish order block at 1.0800-1.0820. Price then rallies to 1.0900. Later, price pulls back to the order block.
.png")
A trader buys at 1.0820 with a stop at 1.0790. The target is 1.0900 again. If price respects the block, the pair may bounce and retest the target. A 80-pip rise from 1.0820 to 1.0900 yields a profit for a position sized at 1 dollar per pip, equal to 80 dollars.
If the block fails, the 30-pip stop keeps the loss limited to 30 dollars. The example shows the value of tight zones and structured levels.
Order blocks affect almost every part of a trade. For entry, many traders wait for price to come back into a bullish order block to look for long setups, or into a bearish order block to look for shorts.
This can help avoid chasing moves at bad prices and instead trade from areas where institutions traded before.
For exit and risk, traders often place stop losses just outside the order block, assuming that if price closes beyond the zone, the idea is wrong. Take profit levels are often set at the next key structure level or the next order block in the opposite direction.
Order blocks can also affect costs and risk because spreads and slippage may widen near strong reactions or during news when price hits the block.
Good situation: Clear strong move away from the block, fresh level, first or second retest, aligns with trend and higher timeframe structure.
Bad situation: Old block hit many times, weak move away, sitting right into major news, or against the dominant trend.
Over-marking zones: Traders identify too many order blocks without considering trend or volume context.
Ignoring volatility: High volatility can invalidate narrow OBs or lead to deep wicks that mislead entries.
Trading without confluence: OBs are strongest when paired with structure, liquidity patterns, or momentum indicators.
Forcing trades during news events: Announcements can cause price to overshoot or skip OB zones altogether.
Supply and Demand Zones: Broader regions of institutional buying or selling pressure.
Displacement: A strong directional move that confirms intent.
Market Structure Break (MSB): A key high or low taken out during an impulsive move.
No. Order blocks can appear in any liquid market, including forex, indices, stocks, and crypto. The idea is always the same. They show where large orders from big traders caused a strong move, and where price may react again in the future.
Many traders start by finding order blocks on the 4 hour or daily charts, then refine entries on 1 hour or 15 minute charts. Higher timeframes tend to give stronger, cleaner zones. Very low timeframes can create many weak blocks that are easy to overtrade.
No price zone works every time. Order blocks can fail if market conditions change, news hits, or the big players close or reverse their positions. This is why clear stops, position sizing, and solid invalidation rules are essential, even when trading the best looking blocks.
They can be helpful, but only if kept simple. New traders should first learn basic support, resistance, trend, and risk management. Then they can add a few clear higher timeframe order blocks to improve trade location, instead of using them as a stand-alone “magic” signal.
An order block is a powerful chart concept that reveals where institutional participants previously executed significant orders, creating zones that influence future price action.
Understanding how order blocks form, how they interact with liquidity and market structure, and how they fit within a broader trend context allows traders to refine their strategy with more precision.
When used with confluence and disciplined risk management, order blocks become a valuable tool for interpreting institutional intent and navigating complex market movements.
Disclaimer: This material is for general information purposes only and is not intended as (and should not be considered to be) financial, investment or other advice on which reliance should be placed. No opinion given in the material constitutes a recommendation by EBC or the author that any particular investment, security, transaction or investment strategy is suitable for any specific person.


World's Best Broker