Published on: 2025-12-29
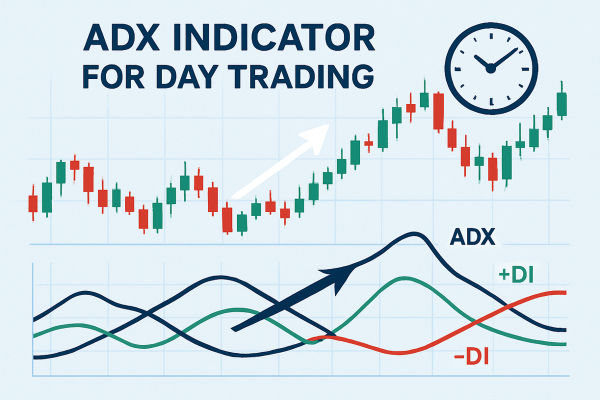
ADX is a technical indicator used to determine whether a market is trending or range-bound. Short for Average Directional Index, it does not indicate price direction. Instead, it quantifies the strength of the prevailing trend.
By applying ADX, traders can screen out weak or choppy conditions and focus on price movements that show stronger, more sustained momentum.
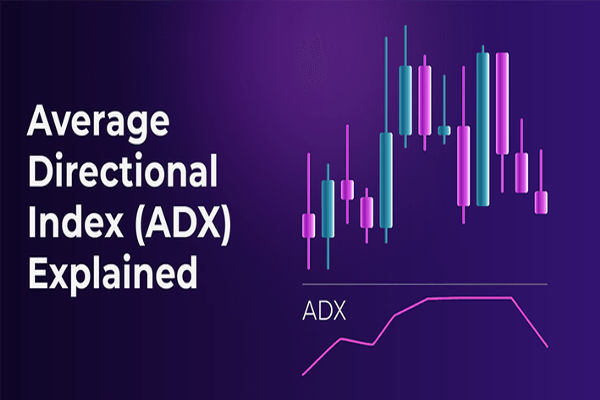
The Average Directional Index (ADX) is a tool used to quantify how strong a market trend is over time. It was created by J. Welles Wilder Jr. and is commonly applied across forex, equity, and commodity markets to assess trend conditions.

ADX is plotted on a scale from 0 to 100. Lower readings indicate weak or absent trends, while higher readings reflect stronger, more established trend conditions. The indicator measures trend intensity only and does not distinguish whether prices are moving upward or downward.
On most charts, ADX appears as a single line below price, often shown together with the +DI and −DI lines for additional context.
+DM = Today’s High − Yesterday’s High (if greater than the downward move)
−DM = Yesterday’s Low − Today’s Low (if greater than the upward move)
TR = the largest of:
Today’s High − Today’s Low
|Today’s High − Yesterday’s Close|
|Today’s Low − Yesterday’s Close|
+DI = 100 × (Smoothed +DM ÷ Smoothed TR)
−DI = 100 × (Smoothed −DM ÷ Smoothed TR)
DX = 100 × |(+DI − −DI) ÷ (+DI + −DI)|
ADX = Smoothed average of DX values, usually over 14 periods
ADX changes based on how the price moves over time.
When prices make strong and consistent moves, ADX tends to rise. When price moves are small or choppy, ADX usually falls.
A smooth trend with higher highs or lower lows pushes ADX higher. Frequent reversals weaken the reading.
Volatility alone does not raise ADX. Price must move with direction and follow-through. Fast but random moves often keep ADX low.
In simple terms, ADX rises when trends are clear and falls when markets are uncertain.
ADX helps traders decide when to trade, not where to trade.
When ADX is low, trend-following strategies tend to perform poorly as price moves sideways. When ADX rises, it indicates strengthening trend conditions that support trend-based trades.
Traders also use ADX to manage risk. Entering a trade when ADX is already very high can mean the trend is mature. Entering when ADX is rising from low levels can offer better timing.
ADX is rising above low levels.
Price is moving with a clear direction.
Strategy matches trend conditions.
ADX flat and low.
Choppy price action.
Trend strategies used in sideways markets.
While ADX has no fixed rules, traders often use rough guidelines.
Below 20: Weak trend or range-bound market.
20 to 25: A trend may be starting to form.
Above 25: Strong trend environment.
Above 40: Very strong trend, but possible exhaustion.
These levels help traders judge conditions, not predict reversals.
ADX can be applied to any timeframe, but the way it behaves changes depending on how fast the market moves. On higher timeframes, such as daily or four-hour charts, ADX is smoother and gives more reliable signals about overall trend strength. This is useful for swing and position traders.
On lower timeframes, ADX reacts faster but can change direction often. Short-term traders use it mainly as a filter, not a signal, to avoid trading when trends are weak. Choosing the right timeframe helps traders align ADX with their trading style and avoid false signals.
Imagine a currency pair moving sideways for several weeks. ADX stays around 15, showing little trend strength. Breakout trades fail, and the price keeps reversing.
Then the price begins to move higher with fewer pullbacks. ADX slowly rises from 15 to 25. This tells traders that a trend is developing. Trend-following strategies begin to work better.
Later, ADX climbs above 40. The uptrend is strong, but experienced traders become cautious. They tighten stops or avoid new entries, knowing the trend may already be well advanced.
This example shows how ADX helps traders judge trend strength, not direction.
Using ADX to predict direction: ADX does not show up or down, only strength.
Ignoring market context: ADX works best with price analysis, not alone.
Entering too late: Very high ADX can signal a mature trend.
Using fixed levels blindly: ADX levels are guides, not rules.
Applying ADX in very short timeframes only: It often works better on higher timeframes.
Trend: The overall direction in which a market price moves over time.
Directional Movement Index (DMI): A technical system that combines ADX, +DI, and −DI to evaluate trend strength and direction.
Economic indicator: A data point, such as employment or inflation figures, used to assess economic conditions and market outlook.
Indicator lag: The delay between price movement and when an indicator reflects that change.
Momentum indicator: A type of technical tool that measures the speed and strength of price movements.
ADX measures the strength of a market trend. It does not tell traders whether the price is moving up or down. It only shows whether the trend is weak or strong, helping traders decide if trend-based strategies are suitable.
ADX is designed for trending markets. Low ADX readings warn traders that the market is sideways. Rising or high ADX readings suggest trends are stronger and more reliable.
Many traders look for ADX above 20 or 25 to confirm trend strength. However, there is no perfect level. ADX should always be used with price action and other tools.
ADX can be used alone, but it is more effective when combined with price analysis or other indicators. On its own, it does not provide entry or exit signals.
Yes, ADX is beginner-friendly because it answers a simple question: Is the market trending or not? The key is understanding its limits and not expecting it to predict price direction.
ADX, short for Average Directional Index, is a technical indicator used to evaluate the strength of a market trend. It helps traders understand whether price movements are organised and meaningful, or weak and directionless.
ADX does not show whether prices are moving up or down. It measures trend strength, helping traders recognise suitable market conditions and choose strategies more effectively.
Disclaimer: This material is for general information purposes only and is not intended as (and should not be considered to be) financial, investment, or other advice on which reliance should be placed. No opinion given in the material constitutes a recommendation by EBC or the author that any particular investment, security, transaction, or investment strategy is suitable for any specific person.


World's Best Broker