Published on: 2025-12-11
Updated on: 2025-12-11
The order book is a live list of all buy and sell orders waiting in the market at different price levels. It shows where traders want to buy, where they want to sell, and how much they want to trade.
Think of it as the market’s heartbeat: every change in liquidity, every shift in supply and demand, and every price movement begins inside the order book. It matters to real traders because it reveals the depth behind the price, helping them judge whether a move is strong, weak, crowded, or thin.
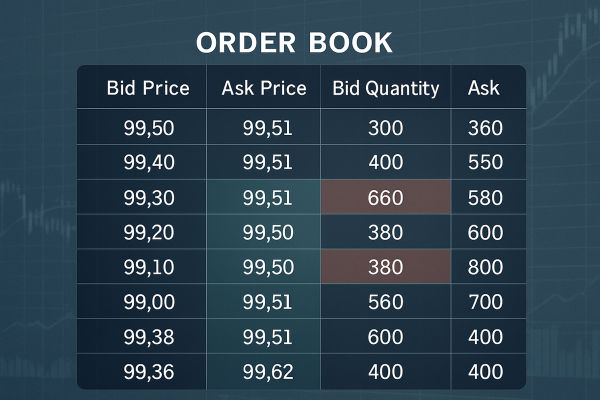
In trading terms, the order book is a structured list of limit buy and limit sell orders arranged by price. On the buy side, the highest bidding prices sit at the top. On the sell side, the lowest asking prices sit at the top.
The difference between the best bid and the best ask forms the spread. The order book is dynamic, updating as traders place new orders or cancel old ones.

Traders encounter the order book inside Level 2 data screens, depth-of-market (DOM) panels, and liquidity ladders.
High-frequency traders, scalpers, and institutional desks watch it most closely, because it reveals real-time liquidity and micro-structure shifts that are not visible on a standard candlestick chart.
The order book changes constantly because:
News or economic releases: When uncertainty rises, traders pull orders, making the book thinner and more volatile.
Liquidity providers adjusting levels: Banks and market makers shift quotes based on risk, spreads, and volatility.
Large players positioning: When big traders place or cancel orders, new clusters form or disappear, signaling upcoming pressure.
Session changes: Liquidity rises during London and New York sessions and fades in quieter periods.
Price approaching key levels: As price nears strong support or resistance, more orders usually gather in the book.
When these forces shift, the book thickens, thins, or becomes unbalanced, giving clues to future movement.

These show how much buyers are willing to pay. Bid prices appear from highest to lowest, with the top bid representing the strongest buying interest.
These list the prices at which sellers are willing to sell. Ask prices run from lowest to highest, with the best ask showing the cheapest available selling opportunity.
Volume at each price level indicates how much liquidity must be absorbed before price can move through that level. High volume often creates temporary support or resistance zones.
The order book updates continuously as new orders enter the market, existing orders are filled or cancelled, and liquidity shifts.
The order book functions as a dynamic auction:
Traders place limit orders that add to the book.
Market orders remove liquidity by immediately matching with the best available price.
As buy and sell orders interact, the last traded price changes.
When large clusters of orders exist at certain levels, prices may stall or reverse.
Because it updates tick by tick, the order book provides short-term insight into supply and demand, something candlesticks alone cannot show.
Liquidity enters and leaves the order book constantly. Several forces shift its shape:
News releases. When major data comes out, new orders flood in and stale orders are canceled. The order book becomes thinner or thicker depending on sentiment.
Market volatility. In fast markets, many traders pull their limit orders, widening spreads and reducing depth.
Time of day. Liquidity rises during major sessions such as London and New York, and falls during quiet hours.
Large participants. Institutions can add or remove blocks of orders that tilt the balance between supply and demand.
The order book influences entry timing because deep buy orders may support price, while heavy sell walls may slow upward moves. It influences exit strategy because traders often look for zones where liquidity is high enough to fill their order smoothly.
And it affects cost and risk because spreads and slippage come directly from order book conditions.
When strong offers stack above price, a rise may slow. Large gaps in depth warn traders that prices could jump quickly if new orders hit the market.
Many price levels with steady size
Small spread
Orders on both sides look stable
Thin depth with gaps
Spread widening
Large orders vanish quickly

Imagine EUR/USD trading at a best bid of 1.1000 and a best ask of 1.1001. The book shows strong buy volume at 1.0999 and 1.0998. A trader wants to buy 100,000 units.
If the book has enough volume at 1.1001, the entire order fills at the ask. If the book is thin and only half the needed size sits at 1.1001, the rest fills at 1.1002. This creates slippage.
Now imagine news hits and those buy levels at 1.0999 and 1.0998 disappear. The trader now senses low support. Even a small sell order could push the price lower. The order book gives the clue before the move.
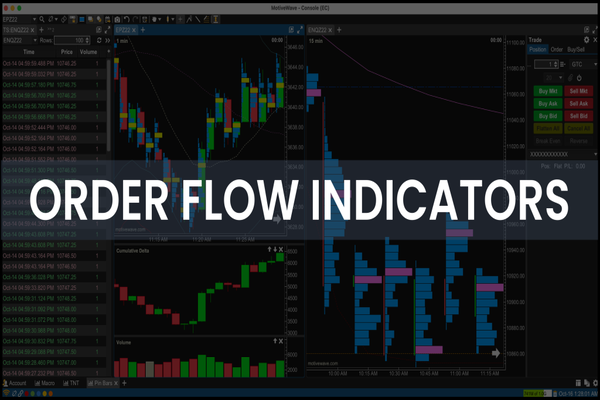
Scalping: Traders look for sudden surges in bid or ask volume to predict micro-moves.
Breakout Trading: Weakening liquidity at key levels may signal an imminent break.
Fade Strategies: Large walls of liquidity may be used as temporary reversal zones.
Risk Management: Understanding depth helps determine realistic stop placement and position sizing.
Order book analysis is especially effective when combined with volume, time-and-sales data, or market structure.
Chasing every large order: some are fake (spoofing) and disappear.
Ignoring liquidity before using large size: leads to slippage.
Watching only one side of the book: imbalance matters more than size alone.
Mistaking iceberg orders for weakness: hidden orders can absorb more than you expect.
Trading news with the book: fast cancellations make it unreliable during volatility spikes.
Look at Level 2 depth to see how much liquidity sits near the current price.
Compare best bid and best ask size to see whether buyers or sellers dominate.
Watch for liquidity gaps, which can cause sharp jumps.
Note whether orders are stable or disappearing quickly, which signals uncertainty.
Before the news, check how the book behaves. A thinning book signals higher risk.
You should check the order book every time before placing a market order, or any time conditions feel unusual.
Liquidity: the order book shows where it exists or where it is thin.
Slippage: caused by insufficient orders in the book at your desired price.
Spread: the gap between best bid and ask seen directly in the order book.
Market orders: consume the book and push price.
Because different brokers connect to different liquidity providers. Each provider has its own order flow, so the visible book varies slightly. Real institutional books aggregate global liquidity; retail books show the slice available from that specific broker or feed.
This often happens because traders cancel their limit orders before they are filled. In some cases, it may be intentional spoofing, where a trader briefly displays size to influence others. The key is to trust patterns over time, not single appearances of big orders.
Not exactly. It shows intention, not execution. Big buy walls can support price, big sell walls can cap price, but both can vanish instantly. It helps you understand pressure, not certainty. The order book is a real-time clue, not a guarantee.
The order book is the live map of buy and sell interest across price levels. It reflects real-time supply, demand, liquidity, and pressure points. Used correctly, it helps traders identify strong zones, avoid poor entries, and anticipate short-term movements. Used poorly, it can mislead traders into trusting unstable liquidity or chasing fast-moving prices.
Disclaimer: This material is for general information purposes only and is not intended as (and should not be considered to be) financial, investment or other advice on which reliance should be placed. No opinion given in the material constitutes a recommendation by EBC or the author that any particular investment, security, transaction or investment strategy is suitable for any specific person.


World's Best Broker