Published on: 2025-12-08
Updated on: 2025-12-08
A trend in trading is one of the most important concepts for understanding market direction and building a solid technical analysis foundation.
It helps traders recognize whether prices are generally moving upward, downward, or sideways so they can make clearer decisions instead of reacting emotionally to short-term movements.
For beginners, identifying a trend provides structure, improves timing, and strengthens confidence when planning trades.
A trend is the overall direction in which an asset’s price is moving over a period of time.
When price consistently makes higher highs and higher lows, it is in an uptrend. When price forms lower highs and lower lows, it is in a downtrend. If price moves within a narrow range without clear direction, it is considered a sideways trend or range-bound market.
Traders use trends to understand market bias and align their strategies with the dominant direction instead of trading against it.
Imagine a stock that has been steadily climbing for several weeks. Each time it pulls back slightly, it rises again to a new high. This repeating pattern signals an uptrend, suggesting buyers are in control.
If the same stock begins forming new lows after each bounce, it indicates a downtrend, meaning sellers are dominant.
Traders look for these patterns so they can trade in the same direction as the prevailing trend instead of guessing when the market might reverse.
Look for repeating patterns of highs and lows
Use moving averages to highlight direction
Observe trendlines that connect major turning points
Analyze price momentum to confirm strength
Monitor breakouts from ranges to spot new trend formation
Following the trend gives traders a clearer plan for entries, exits, and risk management by encouraging discipline over impulse.

Price makes higher highs and higher lows. Buyers dominate.
Price makes lower highs and lower lows. Sellers dominate.
Price moves in a horizontal range with no strong buyer or seller control.
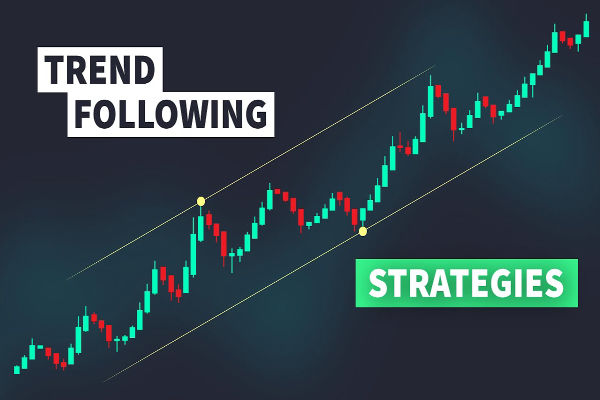
Trend trading strategies focus on using technical indicators to spot opportunities in both rising and falling markets. These strategies help traders understand whether momentum is building or weakening so they can make informed decisions.
Before applying any trend-based method, it’s important for traders to understand how each indicator works to avoid misreading signals.
This approach uses an indicator that smooths out price data over a chosen period, creating a single flowing line on the chart. This line helps traders see whether the market is trending upward or downward.

The RSI is a momentum indicator that helps traders identify whether an asset may be overbought or oversold. An overbought reading suggests the asset may be priced higher than its perceived value, while an oversold reading suggests the opposite.
The ADX helps traders measure the strength of a trend rather than its direction. It also uses a scale from 0 to 100, where higher readings reflect stronger momentum.
A pullback occurs when the price temporarily moves against the prevailing trend before resuming its original direction. Trend traders often look for these small retreats as opportunities to enter the market at more favorable levels.
Counter-trend trading aims to take advantage of potential trend reversals. By analyzing indicators such as RSI, moving averages, or ADX, traders try to identify when momentum may be shifting in the opposite direction.
If a trader enters early enough, they may benefit from the beginning of a new trend. However, this approach carries higher risk because predicting reversals with complete certainty is impossible. As with all strategies, evaluating risk and reward is essential.
Forcing a trend where none exists: Markets often move sideways; not every move is a trend.
Trading against the dominant trend: Beginners frequently try to catch reversals too early.
Using only one timeframe: A market may appear to be trending on a short timeframe but be range-bound on a higher one.
Ignoring pullbacks and corrections: Trends include fluctuations. A single pullback does not mean the trend is over.
Relying on indicators without observing price structure: Indicators help, but price action confirms the trend.
| Feature | Trend | Trend Reversal |
|---|---|---|
| Meaning | Consistent movement in a general direction | A change from upward to downward movement or vice versa |
| What Traders Watch | Higher highs/lows or lower highs/lows | Breaks of key levels or trendlines |
| Purpose | Helps traders follow the dominant direction | Helps identify potential turning points |
| Market Behavior | Stable and directional | Often volatile and uncertain |
| Trader Use | Aligning trades with the direction | Adjusting positions or preparing for new opportunities |
Trendline: A line drawn across highs or lows to visually represent trend direction.
Momentum: The strength of a trend’s movement.
Pullback: A temporary pause or counter-move within a larger trend.
It shows the overall direction of the market so traders can align their trades with that movement.
No. All trends eventually weaken, pause, or reverse, which is why traders monitor momentum and price structure.
Beginners usually perform better by trading with the trend because it follows the stronger market direction.
A trend is the general direction of price movement and forms the foundation of most technical analysis. Uptrends show buyer strength, downtrends show seller strength, and sideways markets reflect indecision.
By learning to recognize patterns of highs and lows and using tools like trendlines or moving averages, traders gain clearer insight into market behavior.
Understanding trends helps beginners decide when to enter, exit, or avoid trades, ultimately supporting more disciplined and confident decision-making.
Disclaimer: This material is for general information purposes only and is not intended as (and should not be considered to be) financial, investment or other advice on which reliance should be placed. No opinion given in the material constitutes a recommendation by EBC or the author that any particular investment, security, transaction or investment strategy is suitable for any specific person.


World's Best Broker