Published on: 2025-12-08
Updated on: 2025-12-08
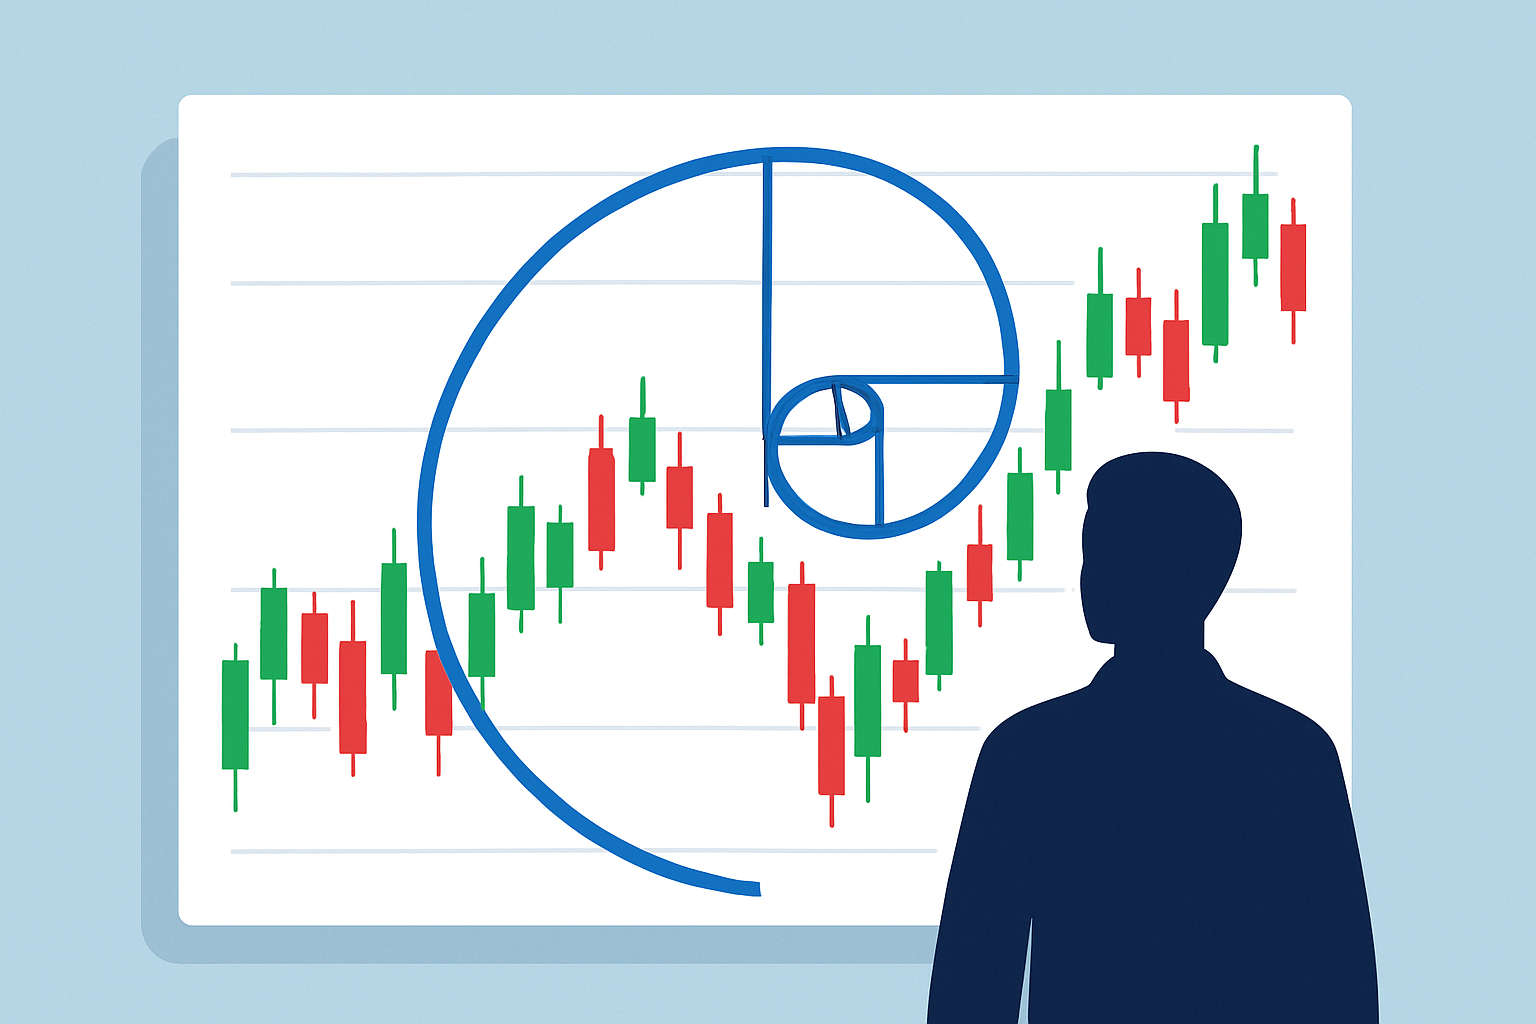
Fibonacci Retracement is a charting tool that draws horizontal lines to show where a price pullback may find support or resistance. Traders use it to spot areas where a trend might pause or reverse.
For beginners, this tool provides structure and clarity, helping them avoid emotional decisions and focus on logical reaction zones.
With practice, traders use these levels to plan entries, protect profits, and strengthen their overall technical analysis skills.
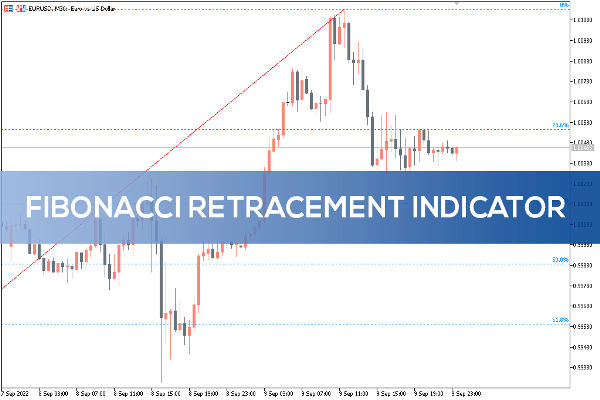
Fibonacci Retracement is a technical analysis tool used to identify potential levels where an asset’s price may pause, reverse, or find support or resistance during a pullback. Traders apply it by selecting a significant price high and low on a chart.

The tool then automatically plots horizontal lines at key Fibonacci ratios, most commonly 23.6%, 38.2%, 50%, 61.8%, and 78.6%.
These levels act as possible turning points in the market.
These are the most commonly used Fibonacci retracement levels and what they generally indicate:
23.6%: Very shallow pullback, often seen in strong trends
38.2%: Moderate pullback area
50%: Popular midpoint used by many traders though not a Fibonacci ratio
61.8%: Deep pullback and a key decision zone
78.6%: Final retracement level before trend invalidation
Fibonacci Retracement helps traders anticipate where a market might retrace before continuing its overall trend. The idea is simple: markets rarely move in a straight line. They swing.
When price pulls back, Fibonacci levels offer a guide to where buyers or sellers may step in again.
For example, if the price of a stock rises from 100 to 150, a retracement tool will mark potential pullback areas between those two prices. If price drops to around the 38.2% or 61.8% level and holds, traders often look for signs that the trend may resume.
These levels do not guarantee reversal. Instead, they highlight areas where the market has historically reacted and may do so again.
Traders typically combine Fibonacci levels with indicators like RSI or moving averages to improve confirmation.

Identify the market trend.
Select a major swing high and swing low.
Apply the Fibonacci Retracement tool on a chart.
Watch how price behaves at key levels such as 38.2%, 50%, and 61.8%.
Look for confirmation signals before entering trades.
Fibonacci Retracement helps beginners recognize logical zones to plan entries, exits, and stop-loss placements. It encourages structured decision-making rather than chasing price or relying on guesswork.
In mid-2023, Apple experienced a strong upward trend. After reaching a notable peak, the stock pulled back. When traders applied Fibonacci Retracement from the swing low to the recent high, price paused near the 38.2% level, where buyers stepped back in.
This reaction strengthened the bullish trend and became a textbook example of how Fibonacci can help identify potential re-entry zones in a trending market.
Fibonacci Retracements help traders find entry points during a price pullback by highlighting areas where the correction might pause or reverse within a trend.
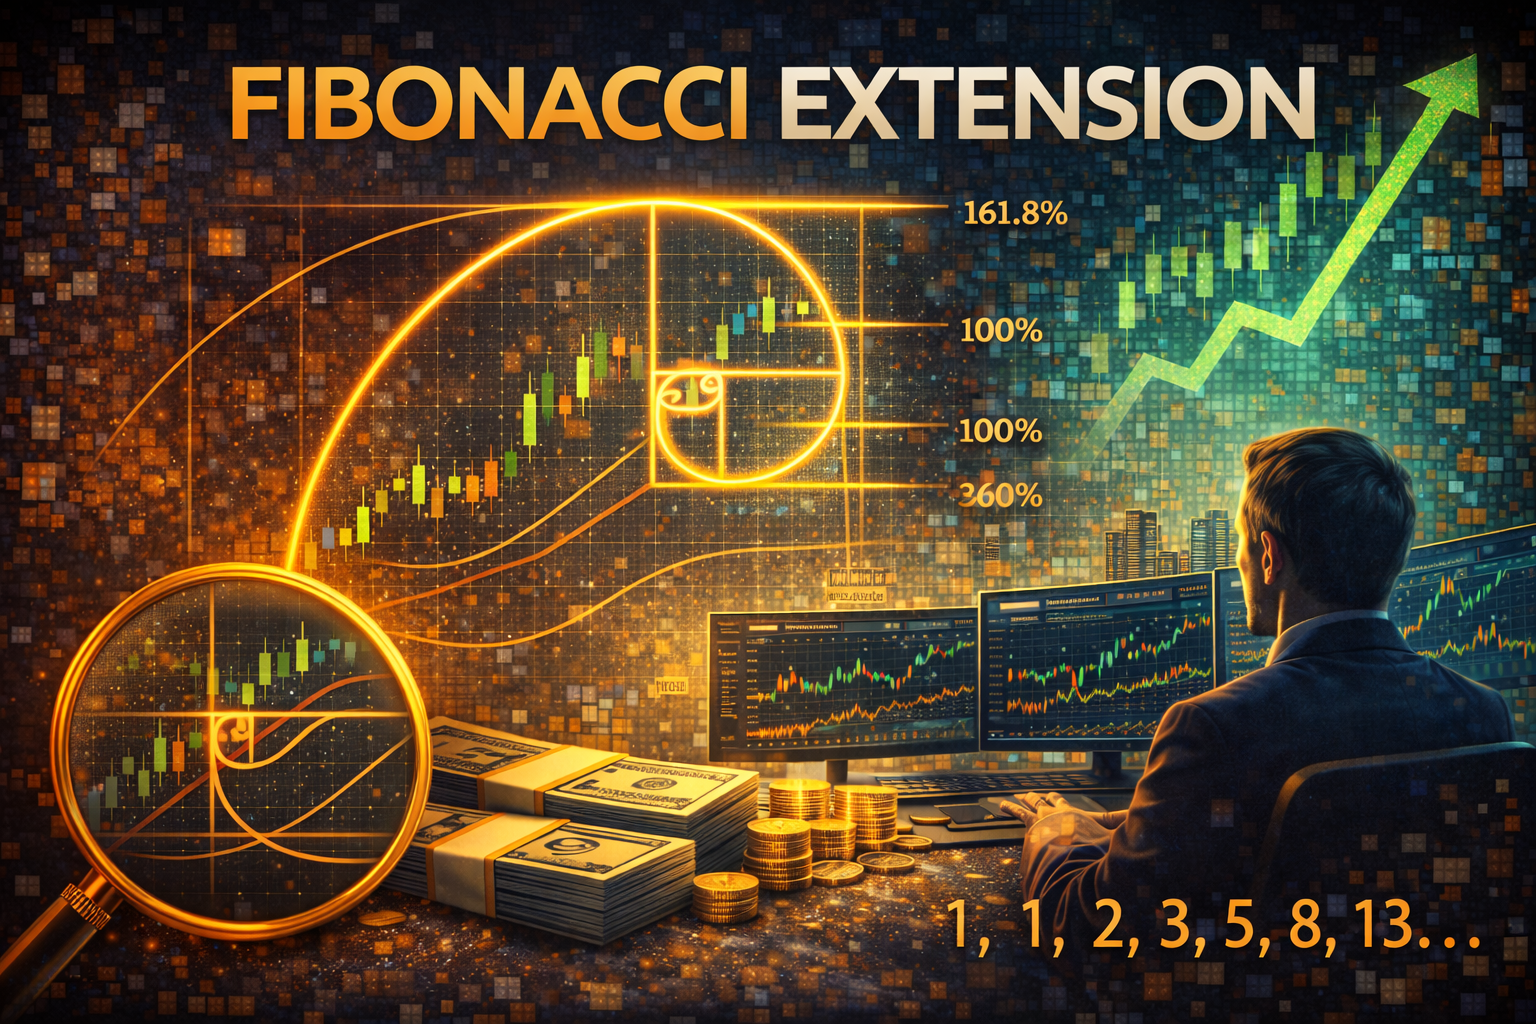
Fibonacci Extensions, on the other hand, help project potential profit targets by showing where the trend might continue or slow down after the pullback ends.
Retracements are drawn using two main points on the chart, while extensions use an additional third point to project future price levels.
| Feature | Fibonacci Retracement | Fibonacci Extension |
|---|---|---|
| Primary Purpose | Identify pullback levels within a trend | Identify future price targets once a trend resumes |
| Used When | Price is correcting or retracing | Price breaks beyond the previous swing high or low |
| Common Levels | 23.6%, 38.2%, 50%, 61.8%, 78.6% | 127.2%, 161.8%, 200%, 261.8% |
| Helps Traders | Spot potential support and resistance during a pullback | Estimate profit targets or continuation points |
| Placement on Chart | Between a major swing high and low | Projected beyond the swing high/low after retracement |
Avoiding these mistakes helps traders use Fibonacci Retracement more effectively:
Drawing Fibonacci levels in the wrong direction: Always draw from swing low to swing high in an uptrend, and swing high to swing low in a downtrend.
Using Fibonacci levels without confirming the trend: Fibonacci works best during trending markets. In sideways or choppy conditions, levels lose reliability.
Entering trades solely because price touches a Fibonacci level: Traders should wait for confirmation signals such as candlestick patterns, trend continuation signs, or indicator alignment.
Forgetting to consider multiple timeframes: A Fibonacci level on a higher timeframe often carries more weight and may override lower-timeframe signals.
Ignoring market context: News events, earnings announcements, or sudden volatility can invalidate Fibonacci reactions.
Support and Resistance: Key price zones where buying or selling pressure often slows or reverses movement.
Trendline: A visual line that shows the direction of the market trend.
Swing High / Swing Low: Significant turning points used as anchors for drawing Fibonacci levels.
Fibonacci Retracement helps traders identify possible price levels where a pullback may pause or reverse during a trend.
No. They only highlight potential reaction zones. Traders still need confirmation from indicators or price action.
The 38.2%, 50%, and 61.8% levels are the most watched because they often align with natural pullbacks.
Fibonacci Retracement is a straightforward charting tool that helps traders identify potential support and resistance areas during a market pullback.
By measuring the distance between a major swing high and swing low, the tool highlights percentage levels such as 38.2%, 50%, and 61.8%, where price may pause, bounce, or reverse.
For beginners, combining Fibonacci levels with trend analysis and confirmation indicators can significantly improve clarity and decision-making in fast-moving markets.
Disclaimer: This material is for general information purposes only and is not intended as (and should not be considered to be) financial, investment or other advice on which reliance should be placed. No opinion given in the material constitutes a recommendation by EBC or the author that any particular investment, security, transaction or investment strategy is suitable for any specific person.


World's Best Broker