Economic indicators are data series that describe the health and direction of an economy, including prices, jobs, output, spending, and credit conditions.
They are commonly classified as leading, coincident, or lagging based on how they move relative to the business cycle, which directly affects timing decisions.
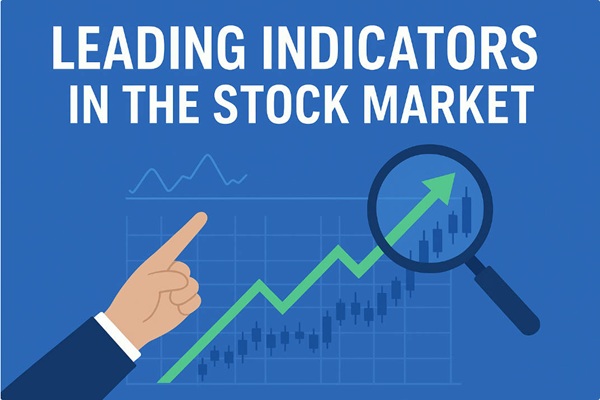
For timing purposes, indicators can be leading or lagging: use leading series to set early entries and lagging series to confirm trends worth holding.
Why Indicators Matter for Timing
Indicators shape expectations for growth, inflation, and policy, which can influence interest rates, currencies, and equity valuations.
A clear map of leading and lagging series helps improve entries and exits while avoiding whipsaws from noisy first releases and later revisions.
Leading, Coincident, Lagging at a Glance
Leading: new orders within PMIs, building permits, consumer expectations, credit conditions, and term spreads that often turn before broader activity.
Coincident: industrial production, retail sales, hours worked, payroll levels, and real income that move with current conditions.
Lagging: core inflation measures, unit labour costs, unemployment rate, and loan delinquencies that confirm trends after they begin.
Diffusion approach: PMI readings are diffusion indices, where values above 50 indicate broad expansion and below 50 indicate broad contraction.
Reducing Timing Errors in Practice
Use breadth: require two or more leading series to turn in the same direction before acting.
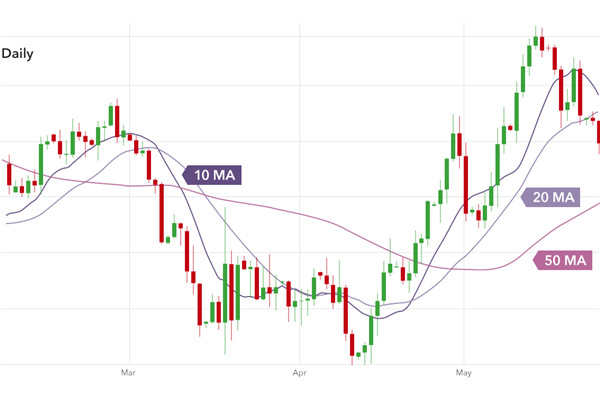
Smooth noise: look at three-month averages for volatile or survey-based prints to reduce false signals.
Respect revisions: delay larger exposure changes until at least a second release confirms direction.
Calendar discipline: note release dates and avoid oversized positions in volatile first prints.
Timing Decision Tree
Use this simple three-step sequence to guide entries and sizing :
Step 1: Check breadth. Are two or more leading indicators improving? If yes, proceed. If no, wait or reduce size.
Step 2: Check coincident confirmation. Have industrial production, payrolls, or retail sales also turned? If yes, add exposure. If no, hold pilot position.
Step 3: Check lagging divergence. If core inflation or unemployment is moving opposite to the leading series, cap position size and set tighter review triggers.
Practical Example
A trader considers buying a cyclical stock at $50.00 after new orders within the manufacturing PMI rise for two months and the yield curve steepens, suggesting an early upturn.
The trader buys $5,000 at $50.00 with a review trigger if PMI momentum stalls, waits for the second payroll release to confirm the trend, then adds $5,000 at $52.00 when industrial production also turns up.
The trader uses a partial profit plan near $58.00 if leading breadth weakens again, while lagging inflation staying high but cooling on a three-month view supports holding the core rather than chasing a late breakout.
Revision Protocol
First releases of major indicators such as GDP, payrolls, and retail sales are often revised in subsequent months, which can reverse initial signals.
Revision patterns can be systematic: GDP tends to see large negative revisions at the start of recessions, and payroll employment is more likely to be revised up during expansions and down during recessions.
On first release: trade at half the intended size or use pilot positions to limit exposure to revision risk.
On second release: if direction is confirmed, scale to full position; if reversed, exit and reassess.
Track revision patterns: some series revise consistently in one direction, which can inform pre-positioning.
Conflicting Signals
When leading and lagging indicators diverge, prioritise breadth over single prints.
If two leading series improve but one lagging series worsens, favour the leading breadth and monitor the lag for confirmation.
If leading indicators weaken while lagging indicators remain strong, treat it as a potential turning point and reduce risk.
When coincident and leading indicators align, that combination is usually more reliable than a single lagging surprise.
Mistakes and Fixes
| Mistake |
Impact |
Fix |
| Treating every series as predictive |
False starts and churn |
Label each series as leading, coincident, or lagging before use |
| Ignoring revisions and base effects |
Reversals after restatements |
Track revision history and prefer three-month averages |
| Trading on single prints |
Overreacting to noise |
Cross-check two or three related series before action |
| Mixing levels with rates of change |
Late or mistimed entries |
Focus on momentum and diffusion rather than levels alone |
| Forgetting publication lags |
Missed moves and frustration |
Right-size positions and stage entries around releases |
Professional Playbook
Professionals blend survey-based and market-based leading signals with slower hard data, then require breadth and persistence before changing exposure or leverage.
They weight indicators by timeliness, revision risk, and historical power, track surprise versus consensus across a basket of indicators, and require a net positive surprise score before increasing leverage.
Simple thresholds such as two consecutive monthly improvements or PMI above 50 avoid over-fitting while maintaining robustness across cycles.
Indicator Readiness Checklist
Before acting on economic indicators, run this four-item check :
Have I labelled each series as leading, coincident, or lagging?
Do at least two indicators from different categories point in the same direction?
Am I sizing appropriately for the first versus the second release?
Have I noted the next release date and planned my review trigger?
Related Terms
Leading Indicator: a series that tends to turn before the economy and helps with early entries and risk-on shifts.
Lagging Indicator: a series that turns after the economy and helps confirm trends and justify holds.
Coincident Indicator: a series that moves with current activity and supports nowcasts and position sizing.
Diffusion Index: a breadth style measure, such as PMI, that summarises how widely conditions are improving or deteriorating around a 50 baseline.
Conclusion
Indicators can be leading or lagging for timing, so results improve when a dashboard combines early signals for entries with slower confirmations for holds and exits.
By managing breadth, smoothing noise, respecting revisions, and using a simple decision tree, timing becomes steadier and less vulnerable to one-off surprises in the data flow.
