Published on: 2026-07-13
Updated on: 2026-07-13
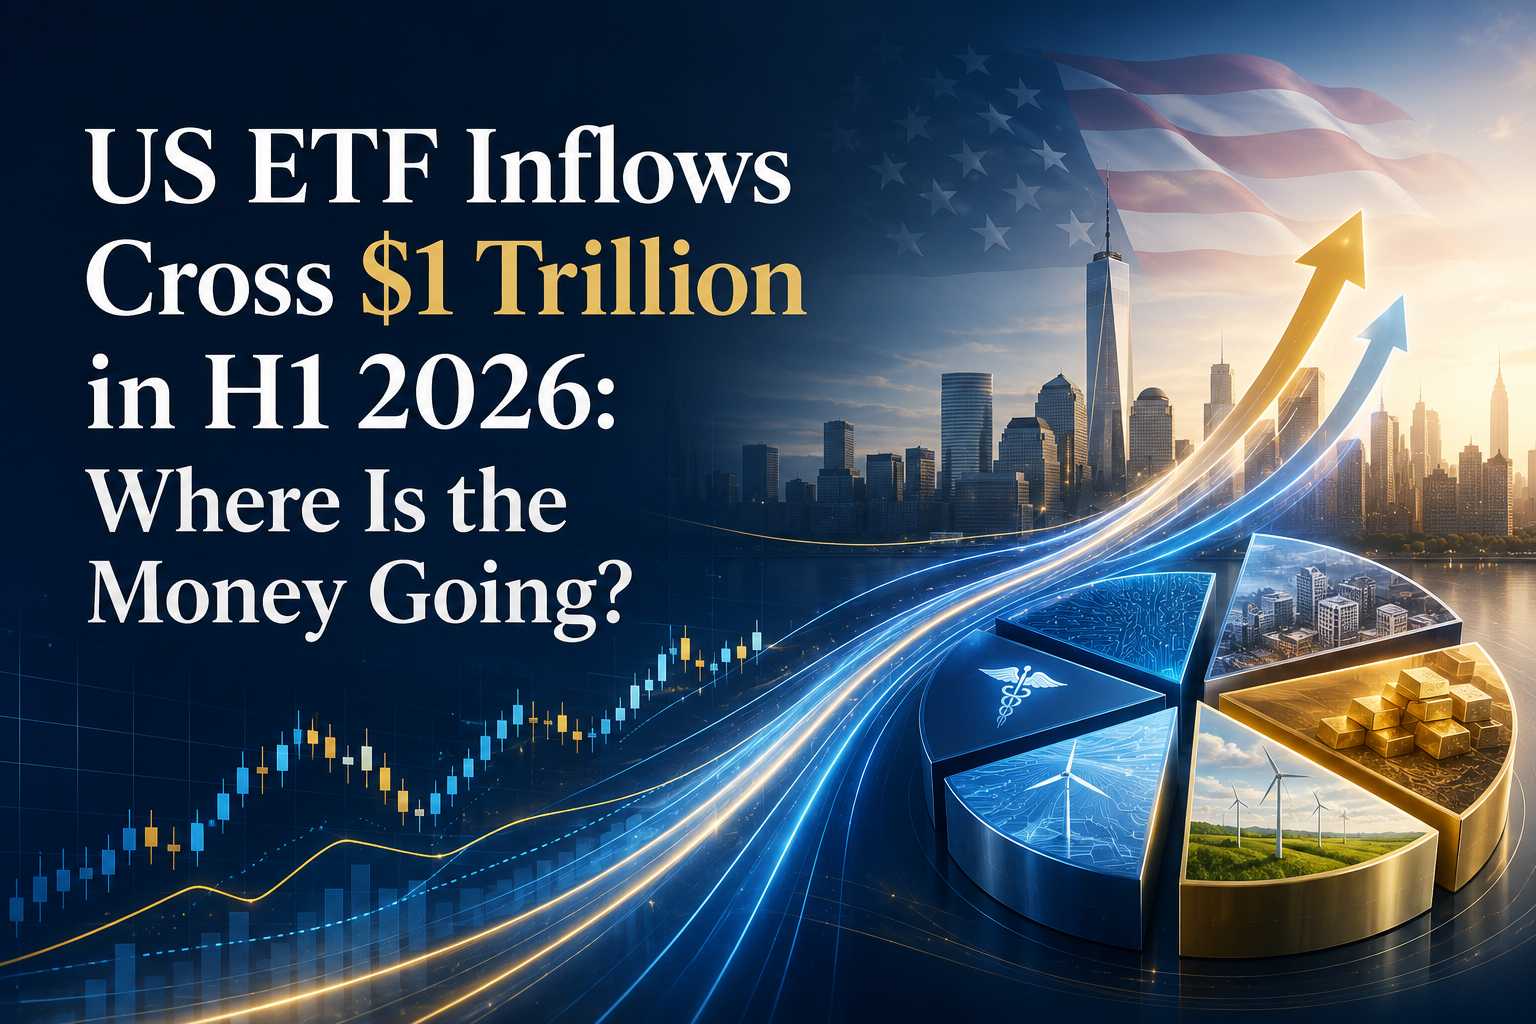
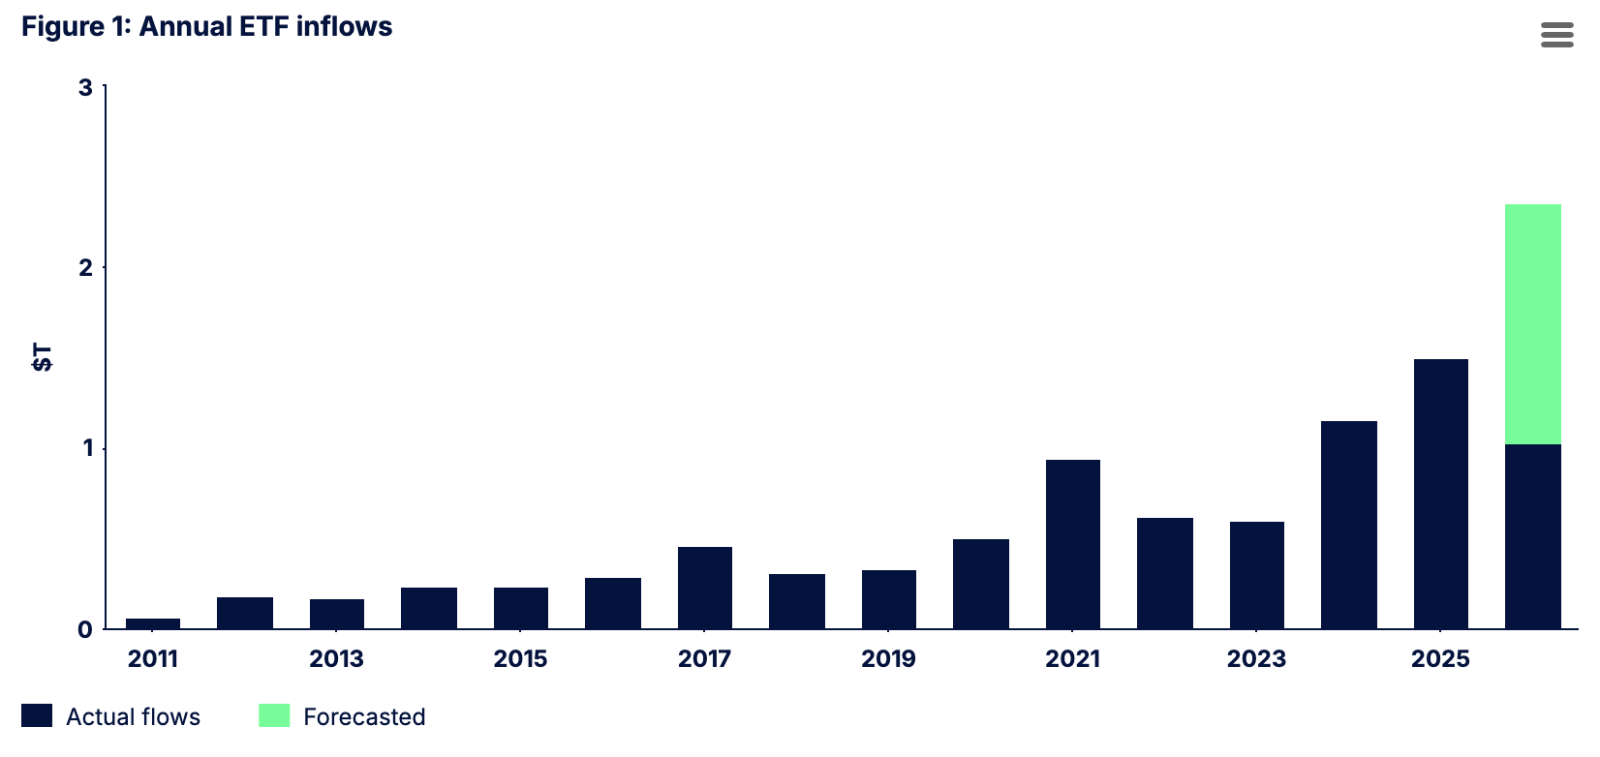
US-listed ETF inflows crossed $1 trillion in the first half of 2026, the first time the industry crossed that threshold during a single January-to-June period. June supplied the closing surge, adding roughly $196 billion and lifting total US-listed ETF assets to a record $15.8 trillion by 30 June.

Investors committed nearly $695 billion to equity ETFs while simultaneously routing $300 billion into bonds. Growth exposure and portfolio stability were bought during the same six-month period.
That combination is the puzzle worth unpacking, because it points in two directions at once: toward diversification across assets and regions, and toward heavy concentration in a familiar set of winners.
US-listed ETF inflows crossed $1 trillion during the first half of 2026, including approximately $196 billion in June.
Equity and fixed-income ETFs captured nearly $995 billion combined, dominating the broader flow total.
International, emerging-market and active ETFs gained capital, but technology remained the leading sector destination.
The figures show greater diversification across asset classes alongside continued concentration in large funds and technology exposure.
Stocks and bonds effectively won the same flow race. Put the half-year in perspective first: on its own it would already rank as the third-largest full-year total on record, and State Street projects roughly $2.3 trillion for all of 2026, a forecast rather than a settled figure. The composition splits cleanly by asset class.
| Asset class | First-half 2026 net inflows | Role in the flow story |
|---|---|---|
| Equity ETFs | $694.5B | Main destination |
| Fixed-income ETFs | $300.0B | Very strong relative to existing assets |
| Money-market ETFs | $22.0B | Smaller but positive |
| Alternative ETFs | $12.5B | Selective demand |
| Mixed-allocation ETFs | $6.1B | Limited share |
| Other ETFs | $1.6B | Small contribution |
| Commodity ETFs | −$7.1B | Net outflows |
Source: State Street Investment Management. Data as of 30 June 2026. Figures in US dollars. Totals may not sum because of rounding.
Equity and fixed-income ETFs together absorbed roughly $994.5 billion of a total that, with every category included, comes to about $1.03 trillion. Everything outside those two buckets combined came to roughly $35 billion, and commodity funds actually posted net redemptions of $7.1 billion.
The record was overwhelmingly driven by equities and fixed income, two asset classes that often serve different portfolio roles: equity flows chase growth, bond flows seek income and stability. Their simultaneous strength frames the rest of the flow map.
State Street’s top-line breakdown is easy to misread. Low-cost ETFs took $506 billion, or 49% of all flows. Active ETFs took $398 billion, or 39%. Bond ETFs took $300 billion, or 29%. The instinct is to add those shares and wonder why they exceed 100%, but they overlap.
A bond ETF can be cheap or actively managed, so it sits inside the other two buckets rather than beside them. Within State Street’s classification, low-cost and active are mutually exclusive groups, while fixed income cuts across both.
The largest slice went to plain, inexpensive exposure. Broad index funds, familiar names like VOO and IVV among them, remain the default building block for long-term allocations, model portfolios and automated contributions.
It is the same gravitational pull that carried a single S&P 500 tracker, Vanguard’s VOO past $1 trillion in assets earlier in this cycle. What has changed is how much company that core now keeps.
Active management inside the ETF wrapper is no longer a curiosity. Globally, active ETF assets reached a record $2.49 trillion at the end of May, with year-to-date inflows of $411.75 billion. That total included $242.18 billion into equity-focused active ETFs and $136.73 billion into active fixed-income ETFs, with the balance spread across other active categories.
These are global figures, a different universe from State Street’s US-listed tally; ETFGI counted about $1.07 trillion into ETFs worldwide through May, and the two should never be added together.
The shift reflects an expansion in what the ETF wrapper can hold. Strategies now include security selection, risk overlays, covered-call income, defined outcomes, tax-aware management and narrow thematic exposure. Many of these approaches were historically offered through mutual funds or separately managed accounts.
The $300 billion entering fixed-income ETFs was concentrated rather than evenly distributed.
| Fixed-income category | First-half 2026 flows |
|---|---|
| Aggregate bond ETFs | $120.2B |
| Government bond ETFs, total | $71.0B |
| ↳ Short-term government | $58.2B |
| ↳ Intermediate government | $19.3B |
| ↳ Long-term government | −$6.5B |
| Investment-grade corporate ETFs | $41.6B |
| Municipal bond ETFs | $30.4B |
| Inflation-linked bond ETFs | $8.8B |
Source: State Street Investment Management. Data as of 30 June 2026. Government bond ETFs are a parent category; the three maturity rows are subdivisions and should not be added separately to the $71 billion total.
Within government bonds, flows clustered at the short end. Long-term government bond ETFs recorded $6.5 billion in net outflows. Across the broader fixed-income market, aggregate bond ETFs attracted the largest total, at $120.2 billion.
That is not a wager on rates collapsing. It reads as a preference for current income, modest duration and credit quality, keeping options open while the interest-rate outlook remains uncertain. The message across the curve is consistent: earn income while limiting excessive duration risk.
US equity ETFs still drew the largest dollar sum, about $441 billion, against roughly $228 billion for internationally diversified funds. New allocations, though, tell a quieter story: non-US funds captured about 34% of equity inflows while holding only 20% of equity ETF assets.
Fresh capital tilted overseas faster than the existing asset base would suggest, even as domestic funds stayed dominant in absolute terms.

Broad emerging-market ETFs attracted approximately $38.5 billion during the first half, already surpassing the $35 billion they gathered across all of 2025. Around 73% of EM funds saw inflows, so participation was broad rather than the work of one or two giants.
The enthusiasm had a ceiling: China-focused ETFs recorded roughly $1.4 billion in June outflows even as diversified EM products kept gaining. Investors were more comfortable owning the asset class than placing a concentrated single-country bet on China.
Sector funds pulled in about $17 billion in June, and technology ETFs received approximately $13.4 billion of that, roughly 78% of the month’s sector flows despite representing about 45% of sector assets. Across the full half, the imbalance is just as stark.
| Sector | First-half 2026 flows |
|---|---|
| Technology | $44.8B |
| Industrials | $9.9B |
| Energy | $9.4B |
| Materials | $6.2B |
| Real estate | $3.7B |
| Healthcare | $1.0B |
| Utilities | −$0.8B |
| Financials | −$1.8B |
| Communications | −$1.8B |
| Consumer discretionary | −$1.9B |
| Consumer staples | −$1.9B |
Source: State Street Investment Management. Data as of 30 June 2026. Figures in US dollars.
Technology was the runaway leader, but industrials deserve a mention of their own: they attracted meaningful capital and were the strongest-performing US sector of the half, according to State Street. Financials, consumer discretionary, consumer staples and communications all posted net outflows.
The contrast shows how heavily first-half sector demand depended on technology, even though industrials, energy and materials also attracted capital.
Strip away the headline and the flows describe a market doing several things at once. The ETF wrapper is gaining ground across strategies, not merely as a passive-equity vehicle.
Index funds, active strategies, bond ETFs, covered-call products, defined outcomes and alternatives now share the same wrapper. The milestone therefore reflects wider ETF adoption, not just a bullish call on stocks.
Portfolios are also being built in layers. Low-cost equities provide market exposure, bonds provide income, and active, emerging-market and sector funds add more targeted positions. That helps explain why passive funds, active strategies and bond ETFs all attracted strong inflows at the same time.
Breadth is thinner than the total implies. Around 2,000 funds outside State Street’s low-cost and active groups captured only 12% of flows, while about 800 recorded no inflows or net redemptions. Most of the money went to a relatively small group of cheap, established or clearly differentiated products.
The mood was not uniformly risk-on. Strong equity buying showed confidence, but demand for short-duration and investment-grade bonds, alongside outflows from long government and commodity funds, pointed to a more cautious portfolio stance.
And because technology ETFs and many broad market-cap-weighted US index funds have overlapping exposure to the largest technology-related companies, the flows may be reinforcing the very concentration they respond to.
The tidy reading of a $1 trillion half-year is that ETFs are simply popular. Investors used the ETF wrapper to combine market exposure, income, active management and international diversification.
The structure can offer trading, cost and tax advantages, although these vary by fund and jurisdiction. Investors nevertheless continued leaning heavily on the largest US companies for growth.
So, the honest answer to the question in the title, then, is both. Record inflows did not express a unified market view; they captured investors diversifying across assets and regions while still concentrating enormous sums in technology and a small number of large funds. The trillion is the hook. The way it was distributed is the actual story.
State Street Investment Management, “ETF inflows set records in first half.”
https://www.ssga.com/us/en/intermediary/insights/etf-inflows-set-records-in-first-half
State Street Investment Management, “Monthly Flash Flows.”
https://www.ssga.com/library-content/pdfs/etf/us/monthly-flash-flows.pdf