Published on: 2026-07-02
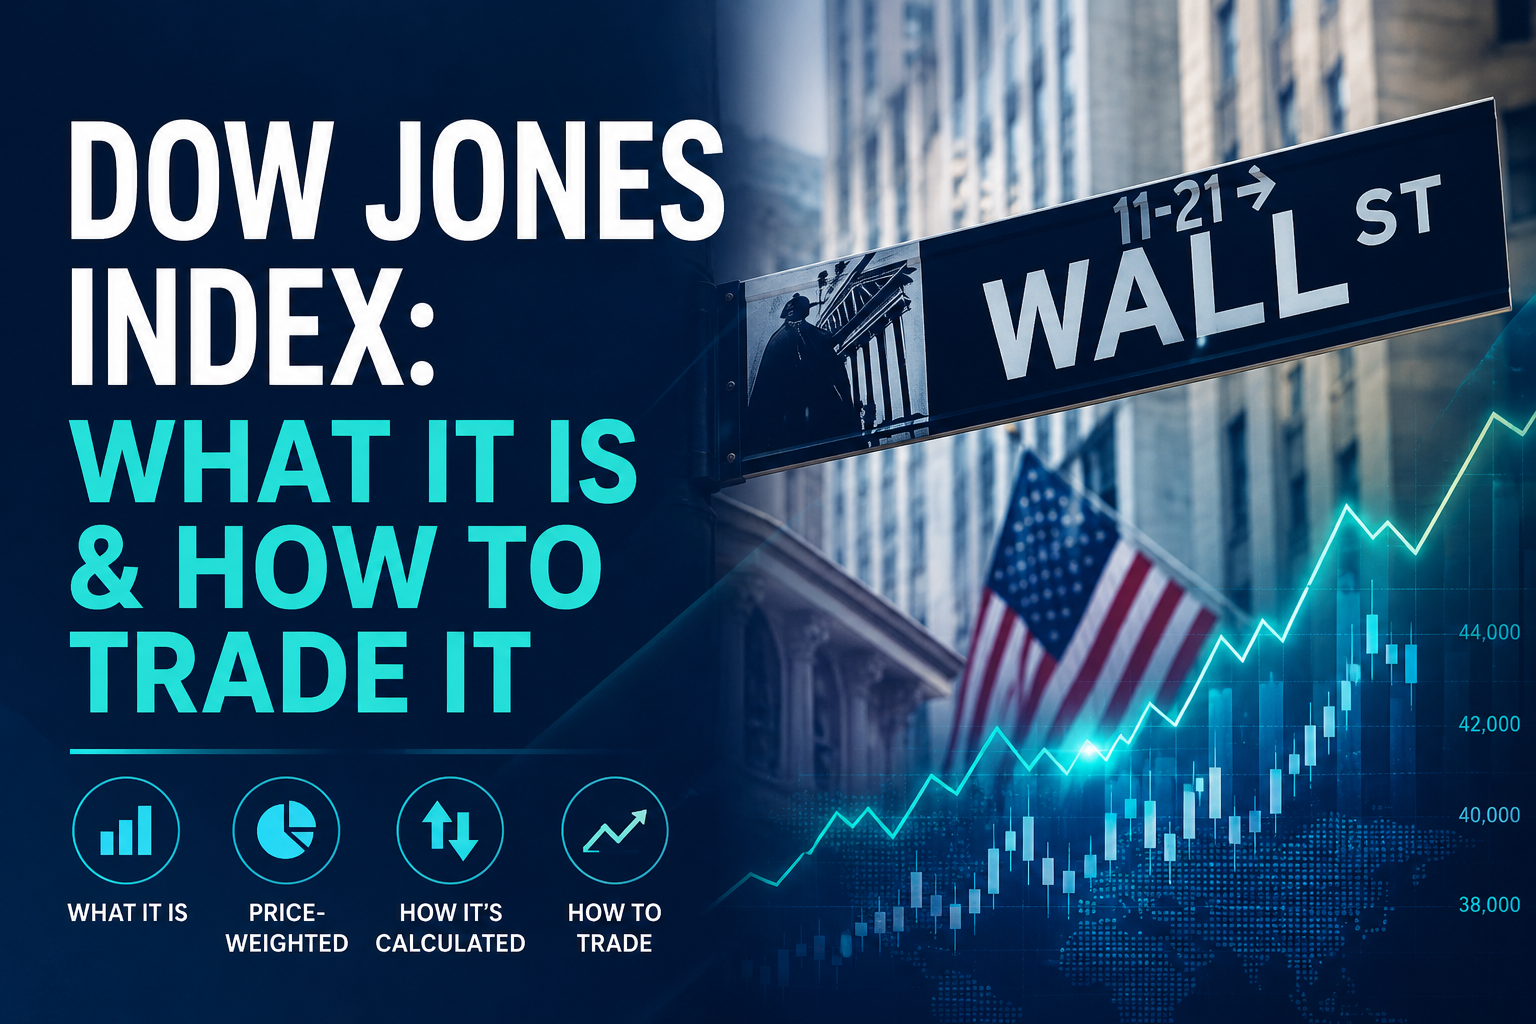
The Dow Jones Index, formally known as the Dow Jones Industrial Average, is a price-weighted stock index that tracks major U.S. blue-chip companies. The Dow contains only 30 companies, so traders should read it as a concentrated benchmark, not as the whole U.S. stock market.
Traders use the Dow to gauge blue-chip sentiment, compare performance with the S&P 500 and Nasdaq 100, and take directional positions through futures, ETFs, options, or CFDs. The index itself cannot be bought directly because it is a benchmark, not a listed security. S&P Dow Jones Indices describes the Dow as a price-weighted measure of 30 U.S. blue-chip companies across all industries except transportation and utilities.
The Dow Jones Index measures the share-price performance of leading U.S. companies selected to represent important parts of the American economy. It is one of the oldest and most widely recognised equity benchmarks, but its structure is much narrower than broader indices.
| Item | Explanation |
|---|---|
| Full Name | Dow Jones Industrial Average |
| Common Names | Dow, DJIA, Dow 30, US30 |
| Index Type | U.S. stock market index |
| Components | 30 companies |
| Weighting Method | Price-weighted |
| Main Trading Use | Tracks U.S. blue-chip sentiment and directional equity risk |
The Dow is often quoted as shorthand for U.S. stocks, but traders should treat it with greater precision. It offers a snapshot of large blue-chip companies, while broader indices provide a wider picture of U.S. equity performance.
Price weighting is the feature that makes the Dow behave differently from the S&P 500 and Nasdaq 100.
In a price-weighted index, companies with higher share prices have greater influence on the index's movement. Market capitalisation does not decide the weight. S&P Dow Jones Indices gives a simple example: if one Dow component has an $180 share price and another has a $90 share price, the $180 stock carries twice the index weight and has twice the impact for the same percentage move.
For traders, this means:
Higher-priced Dow stocks have greater influence on the index.
A company with a larger market value does not always move the Dow more.
The Dow Divisor adjusts the calculation after stock splits, spin-offs, and component changes.
A Dow rally can therefore be driven by a few expensive components rather than broad market participation. Traders often compare Dow movement with the S&P 500, the Nasdaq-100, Treasury yields, and the VIX to gauge whether the move has broader support.
Stock A: $500 share price
Stock B: $50 share price
If both rise 2%:
Stock A rises by $10.
Stock B rises by $1.
Because the Dow is price-weighted, Stock A has roughly ten times more impact on the index.
This is why large dollar moves in expensive Dow components matter. A modest percentage move in one high-priced stock can influence the Dow more than a larger percentage move in a lower-priced stock.
Traders commonly use the Dow to:
gauge sentiment toward U.S. blue-chip companies
compare value stocks against growth stocks
monitor industrial and financial sector performance
confirm or question moves in the S&P 500 and Nasdaq 100
trade broad U.S. equity direction through futures, ETFs, options, or CFDs
The Dow is especially useful when market leadership is shifting. Dow outperformance can point to strength in blue-chip, industrial, financial, healthcare, or defensive stocks. Nasdaq outperformance usually signals stronger demand for technology and growth exposure.
The Dow is calculated by adding the prices of its component stocks and dividing the total by the Dow Divisor.
Dow Jones Index = Sum of component stock prices ÷ Dow Divisor
The Dow Divisor keeps the index comparable when corporate actions occur. Without it, stock splits, spin-offs, and component replacements could create artificial jumps or drops in the index level. S&P Dow Jones Indices explains that divisor adjustments maintain index continuity when changes other than share-price movement would otherwise affect the index.
However, when Alphabet replaced Verizon in June 2026, S&P Dow Jones Indices said the divisor would be adjusted before the market open to prevent distortion of the index’s representation of the market segment it is designed to measure.
The Dow includes large U.S. companies across sectors such as technology, financials, healthcare, industrials, consumer staples, consumer discretionary, energy, materials, and communication services.
(**Note: Transportation and utilities are excluded because they are tracked by separate Dow averages. )
| Company | Ticker | Sector |
|---|---|---|
| 3M | MMM | Industrials |
| American Express | AXP | Financials |
| Amgen | AMGN | Healthcare |
| Amazon | AMZN | Consumer Discretionary |
| Apple | AAPL | Technology |
| Boeing | BA | Industrials |
| Caterpillar | CAT | Industrials |
| Chevron | CVX | Energy |
| Cisco | CSCO | Technology |
| Coca-Cola | KO | Consumer Staples |
| Disney | DIS | Communication Services |
| Goldman Sachs | GS | Financials |
| Home Depot | HD | Consumer Discretionary |
| Honeywell | HON | Industrials |
| IBM | IBM | Technology |
| Johnson & Johnson | JNJ | Healthcare |
| JPMorgan Chase | JPM | Financials |
| McDonald's | MCD | Consumer Discretionary |
| Merck | MRK | Healthcare |
| Microsoft | MSFT | Technology |
| Nike | NKE | Consumer Discretionary |
| Nvidia | NVDA | Technology |
| Procter & Gamble | PG | Consumer Staples |
| Salesforce | CRM | Technology |
| Sherwin-Williams | SHW | Materials |
| Travelers | TRV | Financials |
| UnitedHealth | UNH | Healthcare |
| Alphabet | GOOGL | Communication Services |
| Visa | V | Financials |
| Walmart | WMT | Consumer Staples |
Because the Dow has only 30 companies, individual stocks can materially influence index performance. Earnings surprises, sector rotation, or sharp moves in expensive components can affect the Dow more visibly than in broader benchmarks.
As of July 2026, the constituent data show the Dow holding 30 stocks, including Alphabet, Nvidia, Apple, Microsoft, Amazon, JPMorgan, Walmart, Visa, Johnson & Johnson, Cisco, Caterpillar, UnitedHealth, Goldman Sachs, and the rest of the Dow 30. Alphabet replaced Verizon effective before trading opened on June 29, 2026, broadening the Dow’s exposure to advertising, cloud infrastructure, artificial intelligence, hardware, autonomous mobility, healthcare technology, and media distribution.
S&P Dow Jones methodology states that Dow selection is not governed by quantitative rules alone. Reputation, sustained growth, investor interest, stock price, sector representation, U.S. incorporation, U.S. headquarters, and U.S. revenue exposure all matter. The methodology also states that Dow changes are made as needed, with no annual or semiannual reconstitution schedule.
The Dow began on May 26, 1896, when Charles Dow added the prices of 12 industrial companies, divided the total by 12, and published the result in The Wall Street Journal. The first value was 40.94. The index later expanded to 20 stocks in 1916 and reached its familiar 30-stock structure in 1928.
| Period or Event | What Happened | Trader Takeaway |
|---|---|---|
| 1896 Launch | The Dow began with 12 industrial companies and an initial value of 40.94 | The index has one of the longest live histories in equity markets |
| 1928 Expansion | The Dow reached its modern 30-stock structure | The Dow 30 format became central to its identity |
| 1987 Black Monday | The Dow fell 22.6% in one trading session | Liquidity shocks can overwhelm normal market structure |
| 2024 40,000 Milestone | The Dow first closed above 40,000 | Large round numbers often become sentiment reference points |
| 2026 50,000 Milestone | The Dow closed above 50,000 for the first time | Long-cycle milestones help frame market regime shifts |
The 1987 crash remains one of the most important Dow events because it showed how index selling, futures markets, liquidity stress, and investor behaviour can reinforce each other during a volatility shock. The Federal Reserve’s history notes that the Dow’s 22.6% drop on October 19, 1987 remains the largest one-day stock market decline in U.S. history.
Traders study Dow history to understand how the index behaves during market stress, policy shifts, and major economic cycles rather than to forecast future returns.
The Dow reflects U.S. equity prices, but trading hours depend on the instrument being used.
| Market Layer | Trading Hours | Trader Note |
|---|---|---|
| NYSE Core Stock Session | 9:30 a.m. to 4:00 p.m. ET | Main cash-market liquidity window |
| NYSE Early Session | 7:00 a.m. to 9:30 a.m. ET on relevant venues | Lower liquidity and wider spreads |
| NYSE Late Session | 4:00 p.m. to 8:00 p.m. ET on relevant venues | Earnings and after-hours news can affect pricing |
| EBC U30USD CFD | Mon 01:05 to Fri 23:59, UTC+2/+3 | Broader platform access than the U.S. cash session |
| EBC U30USD Break | Daily 23:59 to 01:05, UTC+2/+3 | Positions may face reopening gaps after breaks |
NYSE lists the core equity session at 9:30 a.m. to 4:00 p.m. ET. It also lists early and late sessions on specific NYSE venues, including early trading from 7:00 a.m. to 9:30 a.m. ET and late trading from 4:00 p.m. to 8:00 p.m. ET.
EBC’s product guide lists U30USD as the US Dow Jones Industrial Average Index CFD, with trading from Monday 01:05 to Friday 23:59, UTC+2/+3, and a daily break from 23:59 to 01:05.
Traders should still check the live platform schedule before trading. Holidays, daylight saving time changes, early market closes, and platform maintenance can alter trading hours. NYSE also publishes holiday and early-close schedules, including 1:00 p.m. ET early closes on selected holidays.
Federal Reserve policy affects equity valuations, funding conditions, and risk appetite. FOMC meetings, CPI, PCE inflation, nonfarm payrolls, and Fed guidance can all trigger sharp movement in Dow-linked products.
When markets price higher rates for longer, equity multiples often come under pressure. When traders price easier policy, blue-chip equities can find stronger support, especially if earnings expectations remain stable.
Treasury yields influence how traders value equities against bonds. Rising real yields can pressure stocks because future earnings are discounted at a higher rate. Falling yields can support equity risk when they reflect easier financial conditions rather than recession stress.
A Dow rally with stable yields and falling volatility usually carries more confirmation than a rally that occurs while yields and hedging demand are rising together.
Because the Dow is price-weighted, earnings surprises in expensive components such as Goldman Sachs, Caterpillar, Microsoft, or UnitedHealth can have a disproportionate impact on the index.
This matters during reporting season. A large earnings gap in a high-priced component can move the Dow even when broader market breadth is mixed.
The Dow does not have the same sector balance as the S&P 500 or Nasdaq 100. It can outperform when investors rotate into blue-chip industrials, financials, healthcare, or defensive consumer stocks.
It can underperform when capital moves aggressively into high-growth technology stocks outside the Dow’s main composition.
Dow rallies are usually more convincing when volatility declines, credit spreads remain contained, and institutional investors continue adding equity exposure.
During risk-off periods, traders monitor the VIX, credit spreads, Treasury demand, and index futures positioning. When the Dow diverges from the Nasdaq 100, the move often signals a shift in market leadership between value-oriented blue chips and growth-heavy technology stocks.
Traders cannot buy the Dow Jones Industrial Average directly. It is an index, not a tradable stock. Dow exposure is usually accessed through futures, ETFs, options, or CFDs.
At EBC, U30USD is the CFD instrument linked to the US Dow Jones Industrial Average Index. EBC’s product guide lists the following specifications.
| U30USD CFD Detail | Specification |
|---|---|
| Instrument Code | U30USD |
| Instrument Description | US Dow Jones Industrial Average Index |
| Contract Size | 10 |
| Lots | 0.01 / 40 |
| Digits | 1 |
| Tick Size | 1 point |
| Leverage | 100 |
| Trading Hours | Mon 01:05 to Fri 23:59, UTC+2/+3 |
| Trading Break | Daily 23:59 to 01:05, UTC+2/+3 |
A trader who expects the Dow to rise can buy U30USD. A trader who expects the Dow to fall can sell U30USD. EBC also states that index CFDs allow traders to speculate on global stock indices and take both long and short positions.
U30USD allows traders to take long or short positions on the Dow without owning the underlying stocks.
Before entering a trade:
Define the market bias.
Check the economic calendar.
Identify entry, stop-loss, and target levels.
Size the position appropriately, as leverage can amplify both gains and losses.
Before entering a trade, traders should define the directional bias, check the U.S. economic calendar, compare Dow movement with the S&P 500 and Nasdaq 100, mark support and resistance, and calculate notional exposure.
CFDs are leveraged instruments. EBC’s product guide warns that CFDs carry a high risk of rapid losses due to leverage and that losses can exceed deposits.
The Dow Jones Index can be traded using several approaches, depending on market conditions. Regardless of strategy, traders should combine technical analysis with macro drivers, including Federal Reserve policy, Treasury yields, earnings, and overall market sentiment.
Best suited to established market trends.
Look for higher highs and higher lows.
Confirm the move with the S&P 500 or Nasdaq 100.
Use previous support or resistance as the trade invalidation level.
Designed to capture momentum after price escapes a consolidation range.
Wait for a confirmed break above resistance or below support.
Stronger setups are usually supported by falling volatility and stable Treasury yields.
Avoid chasing false breakouts without confirmation from broader market participation.
Most effective in range-bound markets.
Look for price rejection at established support or resistance.
Use momentum exhaustion as confirmation.
Exit the setup if price breaks and holds beyond the trading range.
Major economic events can trigger sharp movements in the Dow.
Focus on:
Federal Reserve meetings
CPI and PCE inflation data
Nonfarm Payrolls
Treasury yield movements
Earnings from major Dow components
Suppose the Dow is trading near 52,000 ahead of a Federal Reserve meeting. A trader expecting dovish guidance buys U30USD after the index breaks above resistance at 52,100.
The trader places a stop-loss below 51,850 and targets the next resistance zone at 52,600. The trade thesis depends on lower Treasury yields, improving risk sentiment, and confirmation from the S&P 500 and Nasdaq 100.
If yields rise after the Fed decision or the Dow falls back below the breakout level, the trade thesis weakens. The stop-loss acts as the invalidation point, not just as a loss limit.
The Dow Jones Index is a 30-stock, price-weighted benchmark of U.S. blue-chip companies. It covers major sectors of the U.S. economy but excludes transportation and utilities, which are tracked by separate Dow averages.
The S&P 500 includes 500 leading companies and covers approximately 80% of available U.S. market capitalisation. The Nasdaq 100 tracks 100 of the largest Nasdaq-listed non-financial companies and uses a modified market-capitalisation weighting scheme.
Traders often use the Dow to gauge blue-chip sentiment, while the S&P 500 provides a broader picture of the U.S. equity market. The Nasdaq 100 is more sensitive to technology and growth stocks, as well as to changes in risk appetite for high-duration equities.
| Feature | Dow Jones Index | S&P 500 | Nasdaq 100 |
|---|---|---|---|
| Number of Stocks | 30 | 500 | 100 |
| Weighting Method | Price-weighted | Market-cap weighted | Modified market-cap weighted |
| Main Exposure | U.S. blue-chip companies | Broad U.S. large-cap equities | Large Nasdaq-listed non-financial companies |
| Sector Profile | Mixed blue-chip exposure, excluding transportation and utilities | Broad sector coverage across U.S. large caps | Heavier exposure to technology and growth stocks |
| Common Platform Names | Dow, DJIA, US30, U30USD | SPX500, SPXUSD | NAS100, NASUSD |
| Main Trading Use | Blue-chip sentiment and sector rotation | Broad U.S. equity benchmark | Growth and technology risk appetite |
In short, the Dow is best for reading blue-chip and sector-rotation signals, the S&P 500 is the broader U.S. equity benchmark, and the Nasdaq 100 is the cleaner proxy for growth and technology momentum.
Traders often make six mistakes with the Dow Jones Index.
Traders treat the Dow Jones Index as the entire U.S. stock market. The Dow is much narrower than the S&P 500.
Traders ignore price-weighted mechanics. A large dollar move in a high-priced component can influence the Dow more than a larger percentage move in a lower-priced component.
Traders confuse cash-market hours with CFD trading hours. The NYSE cash session and U30USD trading hours are not the same.
Traders trade high-impact data without accounting for spread widening, slippage, and fast futures repricing.
Traders overuse leverage because index moves appear smoother than single-stock moves.
Traders only watch the Dow. A cleaner read comes from comparing the Dow with the S&P 500, the Nasdaq-100, Treasury yields, the VIX, and the U.S. dollar.
The Dow Jones Index, or Dow Jones Industrial Average, is a price-weighted index of major U.S. blue-chip companies. Traders use it to monitor blue-chip sentiment and compare Dow performance with broader benchmarks such as the S&P 500 and Nasdaq 100.
The Dow Jones Index is the underlying benchmark. US30 is a common trading-platform name for Dow-linked products. At EBC, U30USD is the CFD instrument linked to the US Dow Jones Industrial Average Index.
No. The Dow is an index, not a listed stock. Traders usually access Dow exposure through futures, ETFs, options, or CFDs such as U30USD.
The Dow uses a price-weighted methodology, so higher-priced stocks carry more influence. The Dow Divisor adjusts the calculation after stock splits, spin-offs, and component changes to keep the index consistent.
The NYSE cash session runs from 9:30 a.m. to 4:00 p.m. ET. U30USD CFD trading hours are broader, running from Monday 01:05 to Friday 23:59, UTC+2/+3, with a daily trading break.
The Dow is mainly driven by Federal Reserve expectations, Treasury yields, component earnings, sector rotation, volatility, and overall risk sentiment. Price-weighted mechanics make earnings surprises in expensive components especially important.
The Dow Jones Index is a concentrated, price-weighted benchmark of major U.S. blue-chip companies. Its structure makes it different from the S&P 500, which offers broader market coverage, and from the Nasdaq 100, which is more growth- and technology-focused.
For traders, the critical concepts are practical. The Dow cannot be bought directly. Its movement is shaped by component share prices, the Dow Divisor, macro data, Federal Reserve expectations, Treasury yields, earnings, sector rotation, and risk sentiment. Dow exposure can be traded through futures, ETFs, options, or CFDs such as EBC’s U30USD, but leveraged CFD trading requires careful position sizing, defined invalidation levels, and disciplined risk control.