Bitcoin briefly cleared $124,000 to set a new record, helped by accelerating spot ETF inflows, cooling US inflation, and rising odds of a September Fed rate cut; holding above $124K likely depends on sustained ETF net inflows and supportive macro data in the coming days.
What Just Happened: New All-time High Above $124,000
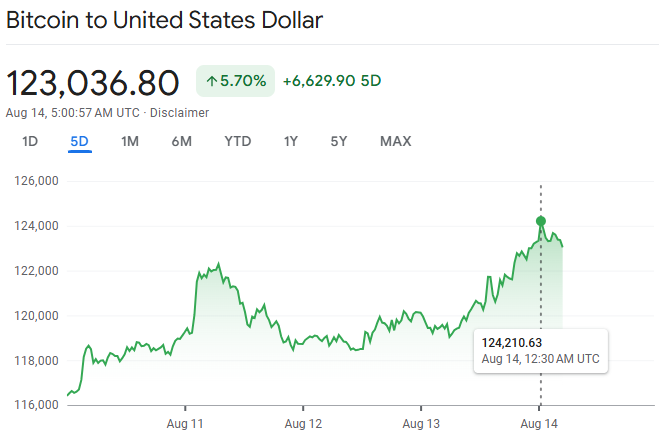
Bitcoin pushed to a fresh record above $124,000, surpassing July's peak around $123,200–$123,500, with multiple outlets citing the breakout occurring late Wednesday in New York trade as risk appetite broadened across markets. Reports cited intraday highs ranging from roughly $124,000 to $124,451 depending on venue and data source, confirming a clear marginal new high versus July's top near $123,205. Ether also advanced toward cycle highs, contributing to a broader crypto rally alongside renewed institutional interest and favourable macro catalysts.
The Drivers Behind The Bitcoin Price
-
Softer US inflation and rising odds of a September Fed cut: July CPI printed at 2.7% year-on-year, a touch under forecasts, pushing market-implied odds of a September rate cut toward roughly 94%, a backdrop that historically supports crypto risk-taking.
-
Spot Bitcoin ETF inflows: Recent sessions showed continued net inflows, including about $65.9 million on August 12, led by BlackRock's IBIT, extending a multi-day positive streak and helping absorb supply as issuers accumulate coins.
-
Risk-on tone in equities: The new high arrived alongside fresh records in US equities, reinforcing the cross-asset risk appetite that often correlates with crypto upswings.
Technical breakout: Clearing the July high triggered momentum buying, with technicians flagging upside potential toward $125,000–$130,000 if spot can hold above the old top and attract follow-through volume.
Context: How Markets Set Up In The High
Into mid-August, bitcoin repeatedly probed the prior July high near $123,205–$123,500 while ETF flows improved after early-month wobbles, setting the stage for a squeeze through resistance when macro data stayed supportive. Flow trackers cited a 5-day net inflow streak culminating in roughly $65.9 million on August 12 across US spot BTC ETFs, with IBIT posting a $111 million single-day intake, underlining institutional demand resilience. The total market capitalisation of crypto climbed to about $4.15 trillion during the breakout, underscoring the breadth of the move beyond bitcoin alone.
Are ETF Flows Strong Enough To Sustain $124K?

Aggregate US spot BTC ETF flows turned positive into the breakout, with day-by-day prints showing nets of $106–192 million on 7–11 August and $150 million on 12 August across major issuers, signalling broad, if variable, demand for physical exposure via ETFs. Reported one-week net BTC ETF inflows of roughly $237 million reinforced that institutions continued to add on balance despite intermittent outflow days earlier in the month. While flow momentum has been a key driver, it remains sensitive to macro headlines and price behaviour around round-number resistance, meaning sustained positive prints are important for stabilising spot above prior highs.
Macro Backdrop: Inflation, The Fed, And The Dollar
The July CPI print at 2.7% year-on-year and a 0.2% monthly gain were taken as benign, supporting a dovish tilt in rate expectations and lifting risk sentiment across equities and digital assets alike. CME-implied probabilities for a September Fed cut around the mid-90s percent range reflected the market's conviction that easier policy is near, a tailwind historically linked with stronger crypto performance as liquidity conditions improve. A softer dollar and risk-on tone complemented this backdrop, helping bitcoin's push to new highs as macro-sensitive buyers leaned into the move.
Technical Picture: Support, Resistance, And Positioning
The prior record zone near $123,205–$123,500 is now first support: sustaining closes above this shelf helps validate the breakout and invites tests of round-number resistance at $125,000 and extension targets into $128,000–$130,000 cited by near-term technicians. Short-liquidation clusters were highlighted between roughly $122,500 and $125,000, implying that breach-and-hold dynamics could force further covering higher while the inverse risk grows if spot stalls and leverage builds below the figure. Analysts also pointed to a constructive structure with higher lows and bullish moving average crossovers, while cautioning that heightened leverage can amplify both rallies and retracements around big levels.
Sentiment And Positioning Risks
Liquidation heatmaps indicated sizeable short interest above $122,800 up toward $125,500, which can fuel upside overshoots in the short run but also leaves the market vulnerable if inflows fade and longs become crowded. The Crypto Fear and Greed Index climbed into “greed,” reflecting a sentiment tilt that can support momentum but often precedes sharper shakeouts if data or policy surprises emerge. Overall, sentiment remains bullish into potential Fed easing, yet price durability above $124K likely hinges on the persistence of net ETF inflows and the absence of hawkish macro surprises.
What To Watch Near-term To Judge $124K Holds
-
ETF flow prints: Daily net flows across US spot BTC ETFs—especially IBIT and other large issuers—are key signals for sustained support above the breakout area.
-
Fed path and data: Any deviation from the current easing narrative via inflation or Fed communications could pressure risk appetite and test support near the old highs.
-
Price behaviour around $124K–$125K: Acceptance above prior highs and a strong weekly close raises odds of extension toward $128K–$130K, while repeated failures risk a drift back into the high-$110Ks to low-$120Ks consolidation band.
Equities correlation: With US stocks printing records, a risk-off reversal could spill into BTC unless crypto-specific flows overwhelm macro signals.
Scenario Analysis For The Next 1–2 Weeks
-
Bullish base case: Continued positive ETF net inflows and steady macro support see bitcoin consolidate above $123K–$124K and probe $125K–$130K, with shallow dip-buys near the old highs.
-
Range/mean-reversion case: Mixed flows and choppy macro keep BTC oscillating between roughly $121K and $125K as the market digests the breakout and awaits clearer policy cues.
Bearish shock case: A hawkish repricing on data or a sharp slowdown in ETF demand triggers a failed breakout and a retest of the $118K–$122K range, where prior consolidations formed.
How Other Assets And Policy Narratives Feed In
Reports emphasised that the equity tape at record highs and a friendlier US policy backdrop have broadened institutional participation, with ETFs acting as the main conduit for new money into BTC. Coverage highlighted institutional adoption via ETFs and corporate balance sheets as ongoing structural drivers, even as day-to-day prices remain sensitive to flows and policy surprises. Ether's strength and significant ETH ETF activity have added to overall digital-asset momentum, though BTC dominance has held given its central role in ETF allocations and macro-linked positioning.
Bottom Line: Can Bitcoin Old Above $124K Now?

Holding above $124K is plausible if daily ETF net inflows remain positive and macro data continue to support a September Fed cut; in that case, the market can base above prior highs and stretch toward $125K–$130K. The main risks are a flow fade or a hawkish macro surprise, either of which could force a slip back toward the $121K–$123K area where liquidity and prior resistance converge, making those zones the key battlegrounds over the coming sessions. Traders should monitor the sustainability of ETF demand and the behaviour around the $124K–$125K band for early signals on whether the breakout sticks or retests ensue.
Disclaimer: This material is for general information purposes only and is not intended as (and should not be considered to be) financial, investment, or other advice on which reliance should be placed. No opinion given in the material constitutes a recommendation by EBC or the author that any particular investment, security, transaction, or investment strategy is suitable for any specific person.


