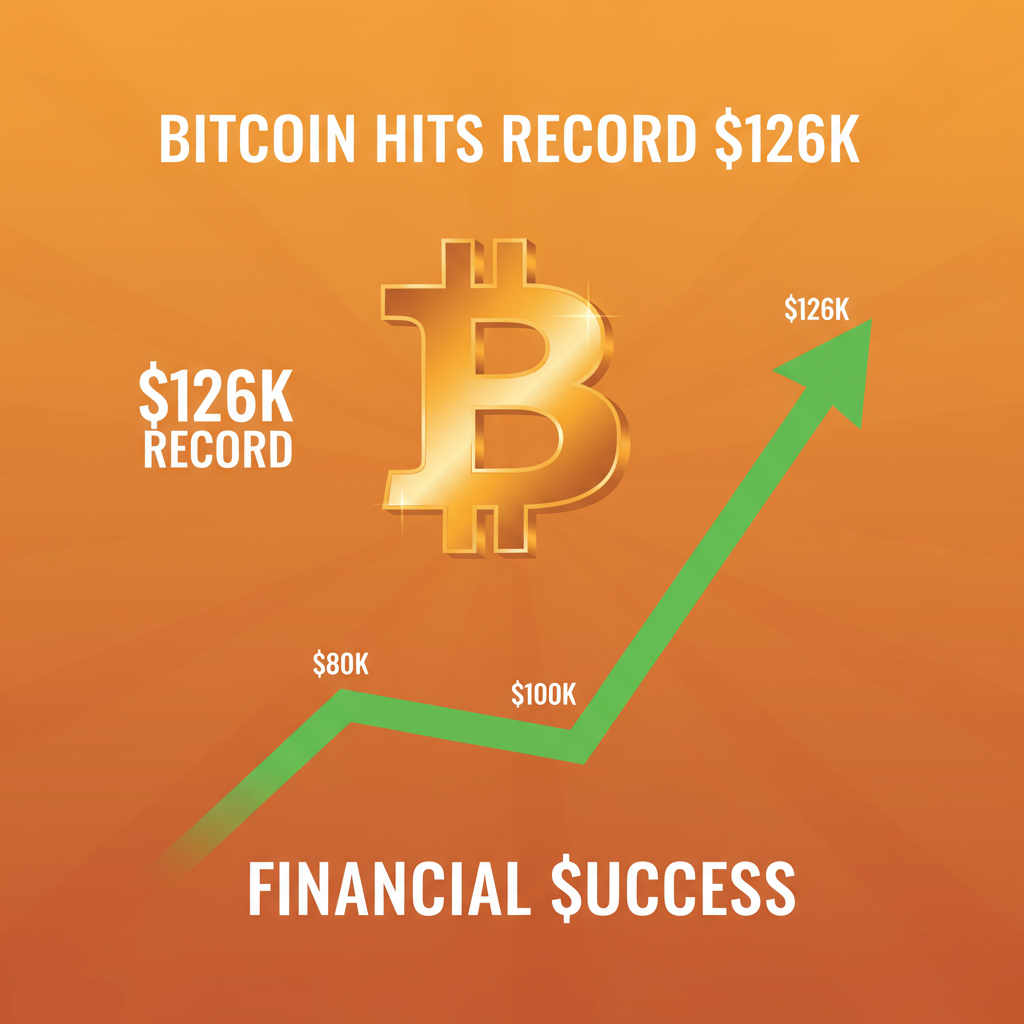
Bitcoin has already tested and briefly exceeded the $126K level in early October 2025, driven by massive spot ETF inflows, weaker real yields, and renewed safe-haven and debasement trade flows. Whether BTC breaks and holds above $126K relies on the strength of ETF demand, the movement of the U.S. dollar, real-yield trends, and the lack of regulatory surprises.
In a bullish base case (ongoing ETF inflows and declining real yields), BTC may remain above $126K and aim for $135–$200K by year-end; in a bearish scenario (dollar strengthening or ETF outflows), a rapid drop to the $95–110K range is likely.
This article will examine the factors behind BTC's ATH rise, its potential and data-driven professional perspective to stay above $126K, crucial macro and technical elements, scenario forecasts, trading advice, and risks.
Bitcoin Reaches New All-Time High ~$126K: What Happened?

In early October 2025, bitcoin cleared previous resistance and printed new intraday highs above $126,000 (some feeds reported ATHs near $126,279). [1]
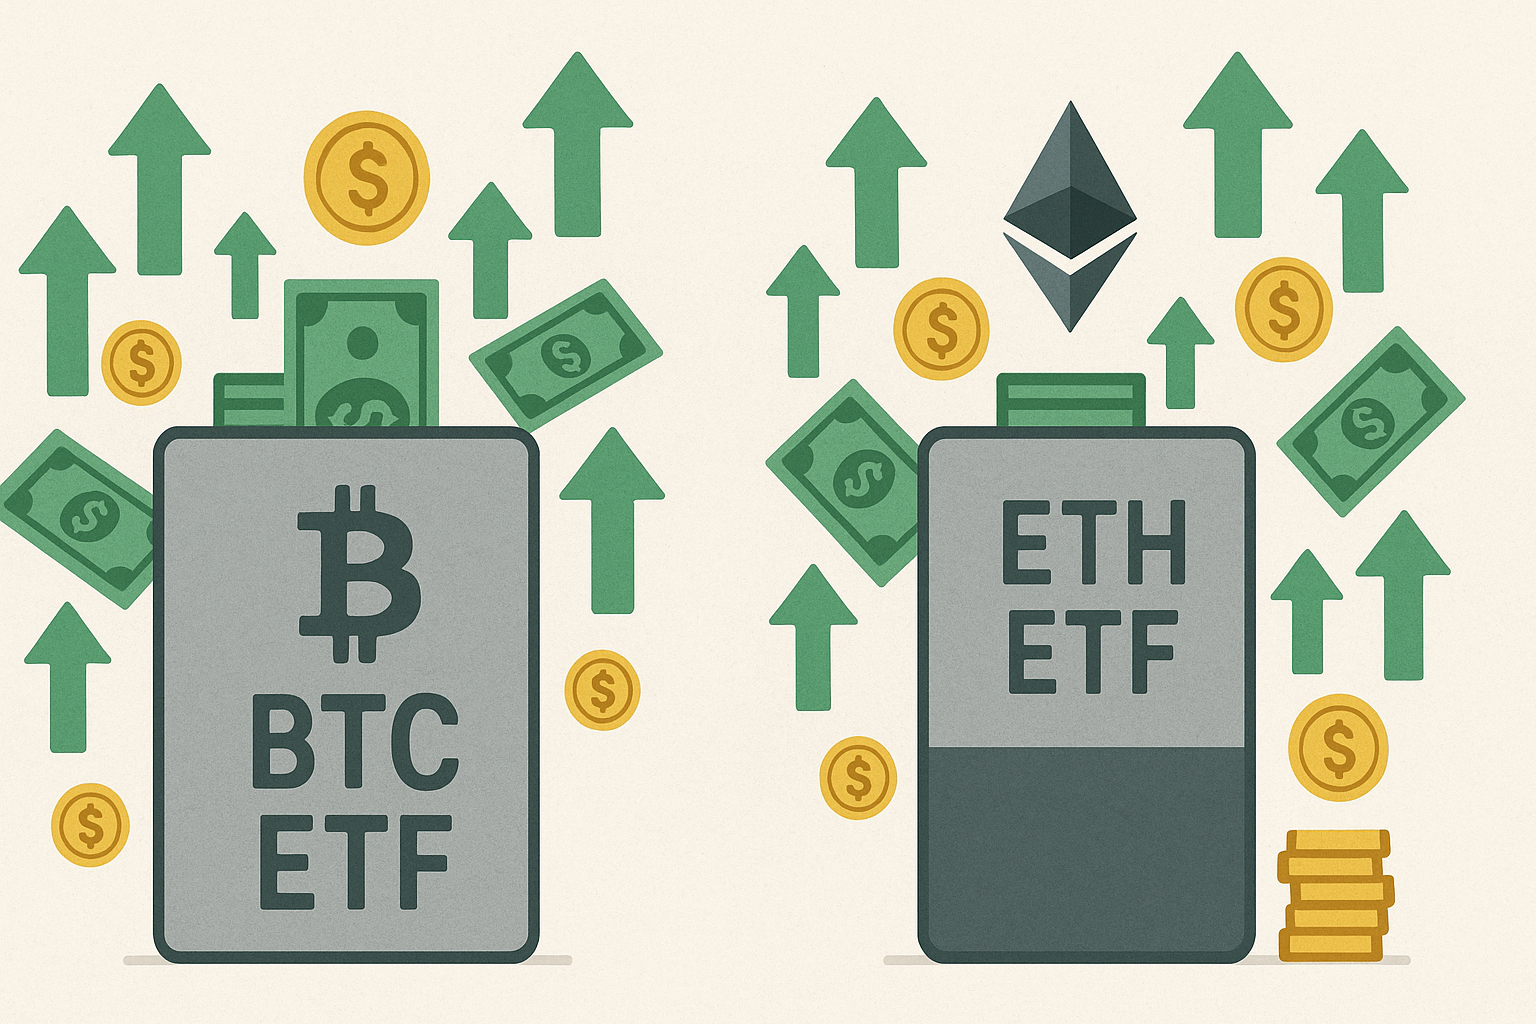
The action coincided with record and continuing inflows into U.S. spot Bitcoin ETFs, such as BlackRock's IBIT and Fidelity's FBTC, which were among the largest beneficiaries.
A widespread "debasement trade" also raised both gold and Bitcoin as the U.S. dollar weakened. Reuters and major market outlets covered the move as a milestone for institutional adoption.
Price snapshot (early Oct 2025): BTC has traded in a range near $121–125K after the spike, showing volatility but not an immediate collapse; many headlines note intraday swings as profit-taking and liquidity absorb the new highs.
What Accelerated Bitcoin's Rally? 3 Key Catalyst Explained

1. Massive Spot-ETF Flows
As mentioned above, the ETF bid is the primary driver of the October movement, as Spot Bitcoin ETFs have attracted substantial capital in 2025. BlackRock's IBIT reported multibillion-dollar weekly inflows, with Fidelity, VanEck and others also contributing. [2]
For example, U.S. spot Bitcoin ETFs recently recorded $1.2 billion in net inflows in a single day, led by IBIT, which pulled in $970 million. IBIT is also approaching $100 billion AUM, and has captured ~$26.4 billion in inflows in 2025 so far.
Additionally, Global crypto ETFs saw $5.95 billion in inflows in the week ending October 4, 2025, with Bitcoin ETFs alone attracting $3.55 billion. These flows represent real physical demand for BTC and are much harder to reverse abruptly than derivatives flows.
2. Macro Cross-Winds: Real Yields and Dollar Dynamics
Gold and Bitcoin often benefit when real (inflation-adjusted) U.S. yields fall and the dollar weakens. In 2025, markets shifted toward an easing narrative, with real yields dropping from earlier highs and the dollar weakening, prompting allocators to move into hard assets.
Commentators have labelled this the "debasement trade," where investors buy gold and BTC to hedge perceived currency dilution and policy risk. [3]
3. Narrative and Liquidity Alignment (Institutional Adoption + Retail Follow-Through)
Institutional products (ETFs, custody, regulated wallets) plus retail FOMO create reinforcing loops. Once headlines show large authorised institutional flows, retail and algorithmic momentum frequently amplify the move.
5 Things That Will Decide Whether BTC Holds Above $126K

1. ETF Flows Continue (Or Dry Up)
Sustained net inflows are the strongest structural support. If ETF purchases slow or reverse, the liquidity that underpinned the breakout may vanish quickly.
2. Real 10-Year Yields Keep Falling (Or Rise)
If real yields in the U.S. begin to increase again, the costs of borrowing and opportunity costs for assets that don't yield go up; this has historically put pressure on BTC.
For context, 10-year real yields have eased to ~1.80%, down from 2%+, increasing the demand for non-yielding assets.
Moreover, markets are increasingly pricing in a potential Fed rate cut by December 2025, which helps the case for lower real yields and continued inflows into Bitcoin and risk assets.
Thus, monitor future TIPS-adjusted yields and Fed-funds expectations.
3. U.S. Dollar Direction
A stronger DXY typically correlates with pressure on BTC; conversely, a softer dollar helps. The October weakness in the dollar helped fuel the "debasement trade." [4]
For instance, the U.S. Dollar Index (DXY) has traded around 101.9–102.5 in early October, down from the 105 range in August.
4. Regulatory Headlines and Exchange Stability
Any credible regulatory clampdown in major markets, or a big exchange/custody event, can trigger sharp reversals. Liquidity is brittle at new highs.
5. Market Technicals and Liquidation Structure
The breakout needs follow-through on volume and limited concentrated margin positioning. If the upward movement was primarily fueled by leveraged longs, a minor disturbance could reverse the trend.
Expert Analyst Bitcoin Price Prediction October 2025
Standard Chartered analysts see an upside path, pointing to $135,000 in the short-term and even $200,000 by year-end under a continued institutional flow scenario.
Bernstein and other bullish shops have been in the $150–200K camp during 2025 institutional adoption narratives; others caution that $200K is less likely without an acceleration of flows.
Analyst targets vary widely; the important point is the range, as many conditional forecasts depend on flow, yields and policy assumptions rather than pure technical extrapolation. Use them as scenario anchors, not certainties.
Scenario Forecasts: Realistic Paths Over the Next 3–12 Months
| Scenario |
Probability |
2025 Target Range |
Key Drivers |
| Bull Case |
~30% |
$135K – $200K |
Strong ETF inflows, weak USD, falling real yields |
| Base Case |
~45% |
$95K – $140K |
Moderate flows, stable yields/dollar |
| Bear Case |
~25% |
$70K – $95K |
Rising yields, USD recovery, ETF outflows |
Listed above is a snapshot of possible paths for Bitcoin through the end of 2025
Below are concise, data-anchored scenarios with probabilities (subjective) and price bands. These are not predictions but probability-weighted views to help your plan.
1) Bull Case: Sustained Breakout (30% Probability)
Thesis: ETF inflows remain elevated, real yields continue downward, the USD weakens, and no major regulatory shock. Institutional adoption spreads to corporate treasury, and sovereign allocation buzz continues.
Price path: BTC consolidates above $126K within weeks, reaching $135–180K by the end of 2025; tail risk up to $200K if flows accelerate.
Key signals: Daily ETF inflows > $1B sustained; falling TIPS yields; strong on-chain accumulation.
2) Base Case: Range With Upward Bias (45% Probability)
Thesis: ETFs keep net positive flows but at lower rates; macro is mixed (some Fed caution, partial dollar recovery). BTC fluctuates between $95K and $140K until year-end, characterised by intermittent volatility and rising lows.
Price path: Pullbacks to $95–110K test demand; rallies to $130–140K test supply.
Key signals: ETF inflows moderate but positive; real yields stabilise; volatility remains elevated.
3) Bear Case: Reversion and Correction (25% Probability)
Thesis: Dollar rebounds, real yields rise (hawkish surprises), or ETFs see net outflows tied to macro shock; regulatory or exchange risk triggers liquidation.
Price path: Rapid fall toward $70–95K (50% drawdown from record highs is within historical norms for BTC). Sustained selling could push lower.
Key signals: ETF net outflows, rising real yields, major regulatory announcements vs exchanges.
Risk Checklist: What Can Break the Bullish Case Tomorrow?
Regulatory shock: A coordinated regulatory policy in the U.S., EU, or China that restricts ETFs, custody or exchanges.
Macro surprise: Sudden strong US CPI/jobs print that keeps Fed hawkish and real yields rising.
Market microstructure event: Exchange outage, major hack, or stablecoin collapse that reverberates into BTC liquidity.
ETF redemption wave: If ETFs see rapid outflows due to margin calls or investor rotation, liquidity may reverse quickly.
If any of these occur, anticipate rapid, significant declines; BTC's fluctuations are the cost of its potential gains.
Tactical Playbook: How Investors & Traders Can Approach Bitcoin in Late-2025
For Buy-And-Hold Investors (Long Horizon)
Consider adding gradually on pullbacks into the $95–110K band rather than buying the breakout at $126K. DCA (dollar-cost averaging) smooths timing risk.
Size the position as a small percentage of investable assets (2–5% typical for crypto allocations, depending on risk tolerance).
Use cold storage for custodial safety and avoid leaving large sums on exchanges.
For Swing Traders (Weeks–Months)
Trade the range: buy value near $95–110K, trim into strength above $135K. Utilise protective stops (e.g., 15–25% stop based on risk).
Monitor ETF flow prints and macro releases closely as they will drive intraday direction.
For Short-Term Traders/Options Strategies
Avoid unhedged directional exposure right before large macro prints. If you want asymmetric upside, consider call spreads or synthetic long with defined risk rather than naked leverage.
Watch options skew: heavy call buying elevates gamma risk and premiums.
Frequently Asked Questions
Q1: Has Bitcoin Already Broken $126K?
Yes. BTC reached intraday highs surpassing $126K in early October 2025; the crucial issue now is maintaining that price point.
Q2: What's Driving the October 2025 Rally?
Heavy spot-ETF inflows, falling real yields, a softer dollar and a "debase/durables" narrative pushed investors into gold and bitcoin.
Q3: Could BTC Reach $200K in 2025?
Possible but conditional. It requires continued acceleration in ETF flows, ongoing dollar weakness, and low real yields. Many banks and some analysts incorporate $150–200K scenarios in their optimistic forecasts, yet the likelihoods are modest.
Conclusion
In conclusion, Bitcoin has already broken $126,000 intraday, but staying above this price is conditional.
For most investors: treat the $126K level as a significant new pivot. Adopt a careful strategy such as applying DCA, monitoring weekly ETF inflows, U.S. real yields, dollar trends, and position sizing according to your risk appetite.
Disclaimer: This material is for general information purposes only and is not intended as (and should not be considered to be) financial, investment or other advice on which reliance should be placed. No opinion given in the material constitutes a recommendation by EBC or the author that any particular investment, security, transaction or investment strategy is suitable for any specific person.
Sources
[1] https://www.reuters.com/world/asia-pacific/bitcoin-hits-all-time-high-above-125000-2025-10-05/
[2] https://www.theblock.co/post/373425/bitcoin-etfs-rebound-with-second-highest-weekly-inflows-since-launch-as-btc-approaches-all-time-high
[3] https://www.theguardian.com/business/2025/oct/09/the-debasement-trade-is-this-whats-driving-gold-bitcoin-and-shares-to-record-highs
[4] https://economictimes.indiatimes.com/news/international/us/us-dollar-in-trouble-bitcoin-gold-and-silver-surge-as-safe-havens-says-expert/articleshow/124433980.cms


