Published on: 2026-06-23
A pivot point is a technical analysis level used to estimate where price may find support or resistance during a trading session.
Traders use pivot points to create a simple price map before the market moves. The main pivot point acts like a reference level. If price trades above it, traders may see the market as stronger. If price trades below it, traders may see the market as weaker.
Pivot points are popular with short-term traders because they are calculated before the trading session starts. This helps traders prepare possible reaction areas instead of chasing price after it has already moved.
.png")
The standard pivot point is calculated using the previous period’s high, low, and closing price.
The basic formula is:
Pivot Point = (High + Low + Close) / 3
For example, if yesterday’s high was 110, the low was 100, and the close was 106, the pivot point would be:
(110 + 100 + 106) / 3 = 105.33
This means 105.33 becomes the main pivot level for the next session. Traders may then watch whether price trades above, below, or around this level.
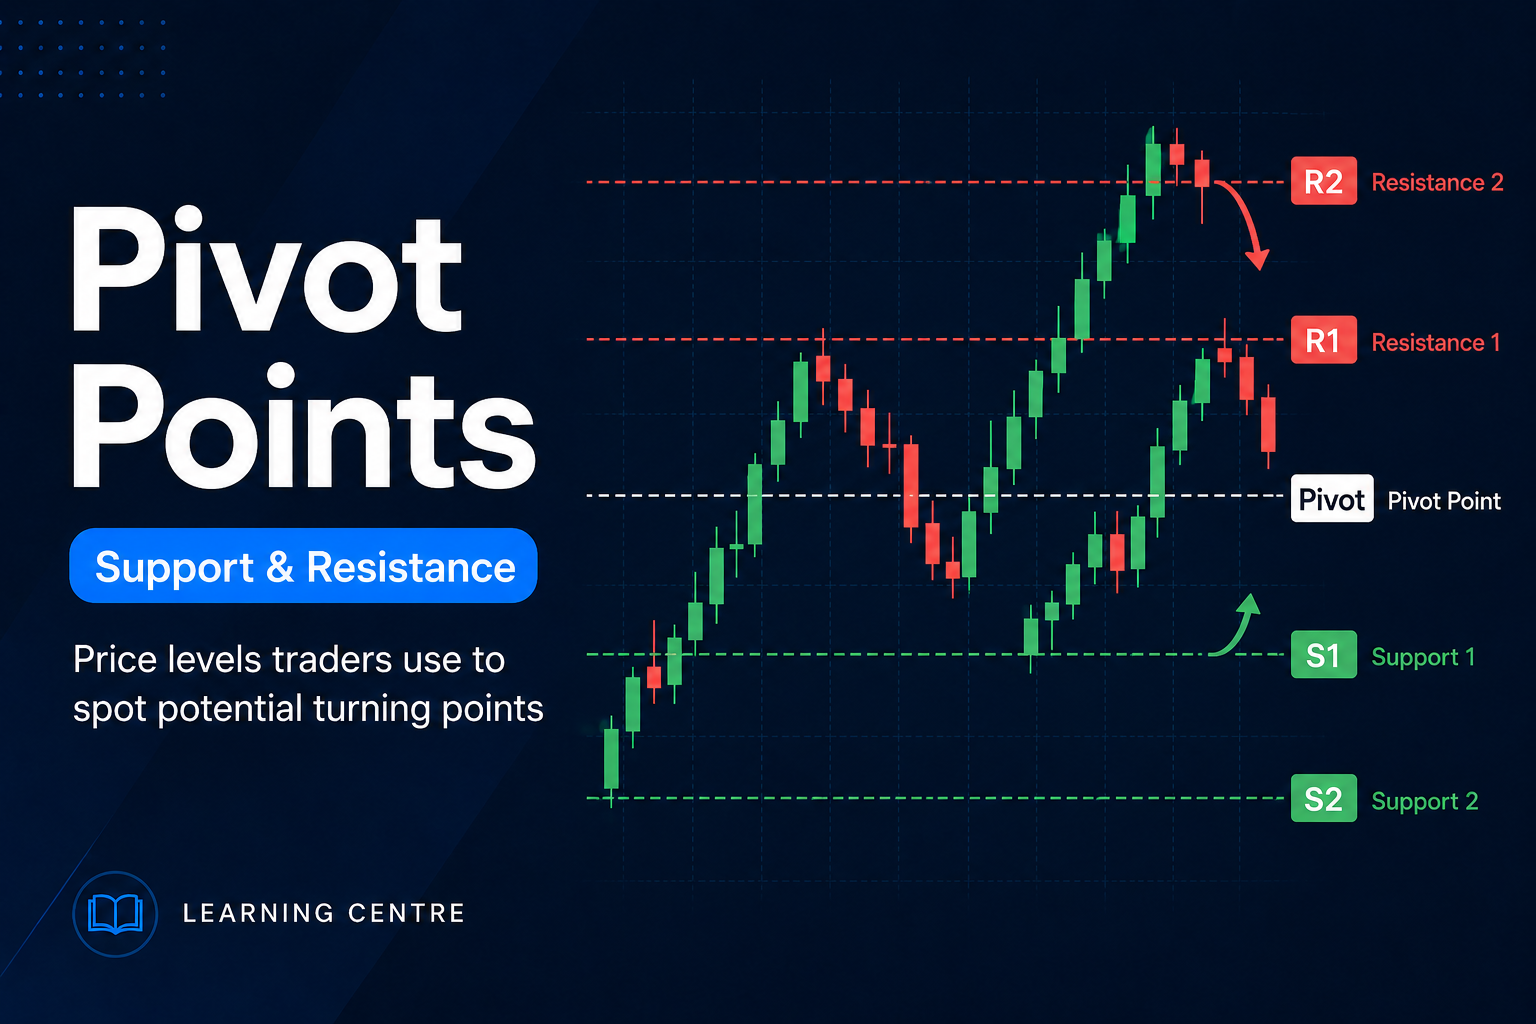
Pivot point tools usually show extra levels above and below the main pivot. Levels above the pivot are called resistance levels. These are often shown as:
R1: First resistance level
R2: Second resistance level
R3: Third resistance level
Levels below the pivot are called support levels. These are often shown as:
S1: First support level
S2: Second support level
S3: Third support level
A simple way to remember them is: R levels are possible areas where price may face selling pressure, while S levels are possible areas where buying interest may appear.
Traders use pivot points to plan possible entries, exits, and risk levels.
If price is above the main pivot point, some traders may look for bullish setups. If price is below the pivot point, some traders may look for bearish setups.
For example, if price rises toward R1, traders may watch whether price rejects the level or breaks through it. If price falls toward S1, traders may watch whether buyers defend the level or whether price continues lower.
Pivot points can also help traders avoid emotional decisions. Instead of reacting randomly to price movement, traders already have possible support and resistance zones marked on the chart.
Pivot points are commonly used in day trading because they are based on the previous trading session.
A day trader may mark the main pivot point, S1, S2, R1, and R2 before the market opens. During the session, they watch how price behaves around those levels.
For example, if price opens above the pivot and holds above it, traders may see the session as more bullish. If price opens below the pivot and fails to move above it, traders may see the session as weaker.
However, pivot points should not be used alone. A trader still needs to check trend direction, price action, volatility, and risk management.
Pivot points are a type of support and resistance, but they are calculated differently. Normal support and resistance levels are often drawn manually from previous price reactions on the chart. Pivot points are calculated using a formula based on the previous high, low, and close.
This makes pivot points more structured, but not automatically more accurate. Price can still break through pivot levels, especially during strong trends or high-volatility news events.
A common mistake is treating pivot points as guaranteed reversal levels. A pivot point is not a wall. It is only a possible reaction zone.
Another mistake is assuming price must fall at R1 or rise at S1. Price may react at these levels, but it can also break through them.
Beginners may also use pivot points without checking the bigger trend. If the market is in a strong uptrend, resistance levels may break more easily. If the market is in a strong downtrend, support levels may fail.
A pivot point should support a trading plan, not replace one.
Support Level: A price area where buying interest may appear and slow a decline.
Resistance Level: A price area where selling pressure may appear and slow a rise.
Technical Analysis: The study of charts, price patterns, and indicators to understand market movement.
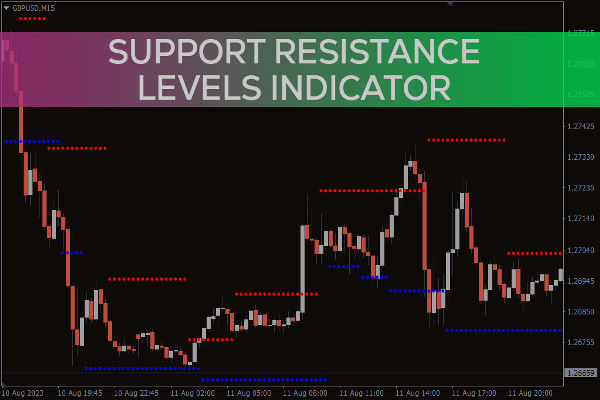
Indicator: A tool that uses market data to help traders analyse price behaviour.
Trend: The general direction of price movement in a market.
Risk Management: The process of controlling possible losses before and during a trade.
A pivot point is a calculated price level used by traders to estimate possible support and resistance areas. It helps traders judge whether price is trading above or below a key reference level.
The standard pivot point is calculated by adding the previous high, low, and close, then dividing the total by three. The formula is: Pivot Point = (High + Low + Close) / 3.
No. Pivot points are possible reaction zones, not guaranteed turning points. Price may bounce from them, pause near them, or break through them depending on trend, volatility, and market conditions.
Yes. Pivot points are popular with day traders because they can be calculated before the session begins. Traders use them to plan support, resistance, entries, exits, and risk levels.
A pivot point is a calculated price level that helps traders identify possible support and resistance areas. It is usually based on the previous period’s high, low, and closing price.
For beginner traders, pivot points are useful because they provide a simple price map before the market moves. However, they should be treated as planning zones, not guaranteed buy or sell signals.