Published on: 2026-08-17
Updated on: 2026-08-17
EUR/USD traded around 1.1580 early Monday, its strongest area since mid-June, and it arrived there on an American story rather than a European one. The pair gathered strength through the early Asian session as the dollar softened on weaker-than-expected US data and shifting central bank expectations.

That followed a roughly 0.36% advance on Friday, with the ECB reference rate set at 1.1567, in a session that saw the dollar index trade down toward the 99.50 area after July retail sales fell 0.6% against expectations for a 0.1% increase.
Spot now sits barely 20 pips below the round number, with a resistance cluster immediately beyond it. Whether those levels give way is the question, and the answer arrives in three instalments this week.
EUR/USD trades near 1.1580, its highest since mid-June, after weak US retail sales cut September Fed hike odds to 33% from 44% a week earlier.
The move is dollar-driven. Friday’s close above the 100-day SMA at 1.1570 repairs a bearish daily sequence rather than extending an uptrend.
Resistance runs 1.1600, the 200-day SMA near 1.1630 and the upper Bollinger Band at 1.1635, then the May 29 high at 1.1685.
Below 1.1570 momentum fades, but 1.1490 to 1.1500 is where a pullback becomes a breakdown.
Wednesday’s FOMC minutes are the main downside risk. Friday’s flash PMIs test whether Europe can add a second leg.
The repricing has been quick. Markets now assign a 33.1% probability to a rate rise next month, down from about 44% a week earlier, according to the CME FedWatch tool, although participants remain convinced the Fed will need to tighten by the end of 2026 with inflation above target for more than five years.
July consumer prices eased, with headline inflation at 3.4% and core at 2.5%, and producer prices came in below forecasts. Retail sales then contracted 0.6% on the month against June’s 0.2% gain, with the annual pace slowing to 5.0% from a revised 6.8%.
Together they describe inflation cooling from the top and demand cooling from underneath. That removes the urgency from the hawkish case without removing the case itself.
The 100-day average has defined this range for weeks. Repeated rejection around it kept the broader daily structure under pressure, a sequence of lower highs and lower lows, even as the rebound from below 1.1400 in late July improved short-term momentum.
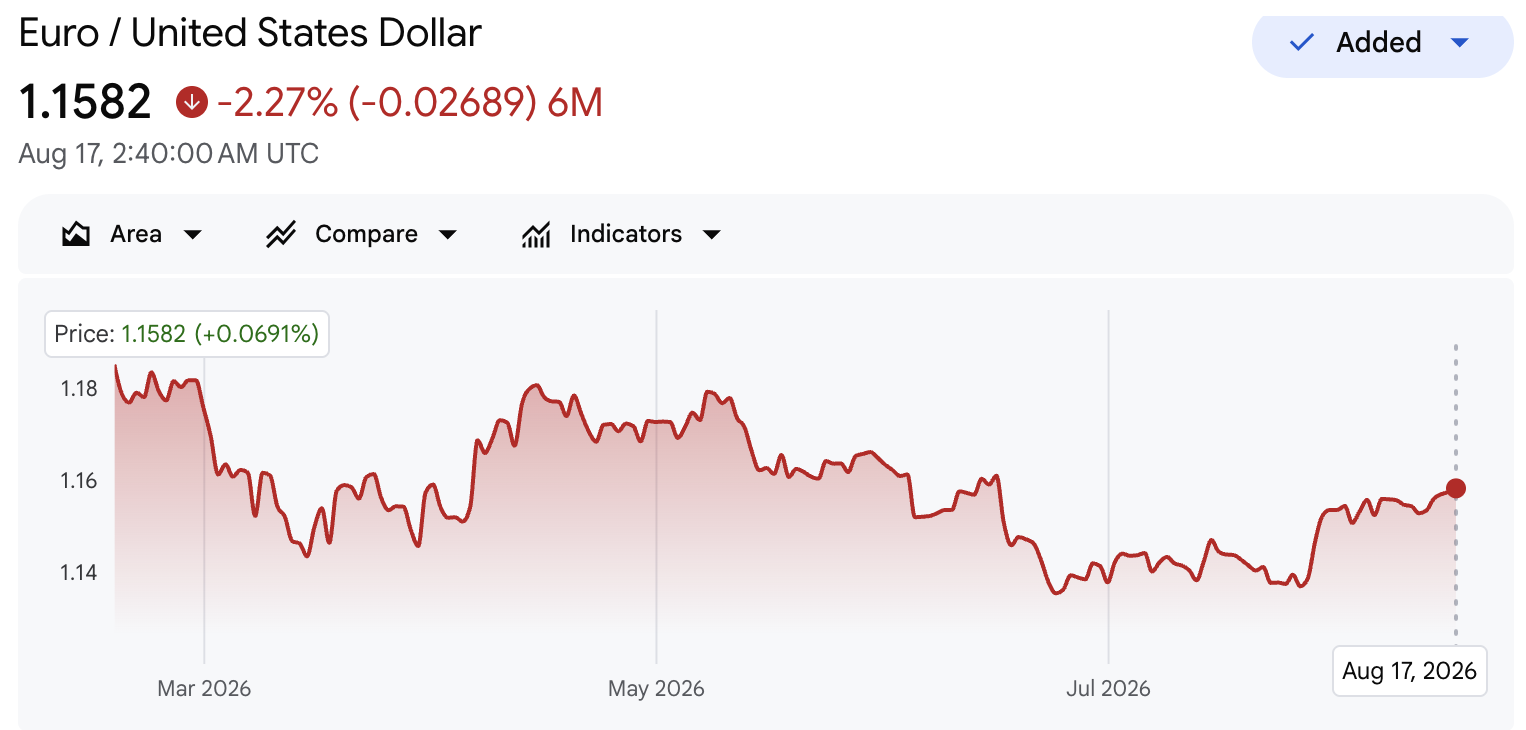
Friday changed the setup. Price closed above the average and held that ground into Monday, which repairs the bearish sequence rather than extending an existing uptrend. The pair now trades above both the 100-day SMA and the Bollinger midline, in the upper half of its recent range.
| Indicator / Level | Current Reading | What It Shows |
|---|---|---|
| Spot EUR/USD | ~1.1580 | Roughly 20 pips below the 1.1600 resistance area |
| 100-day SMA | ~1.1570 | Immediate pivot; holding above it keeps the rebound intact |
| 200-day SMA | ~1.1630 | Major resistance, overlapping the upper Bollinger Band |
| Upper Bollinger Band | ~1.1635 | Upper boundary of the breakout zone |
| Bollinger midline | ~1.1490 | The level where a pullback becomes a breakdown |
| 50-day SMA | ~1.1465 | Deeper moving-average support |
| Lower Bollinger Band | ~1.1345 | Lower boundary of the broader range |
| 14-day RSI | ~63 | Bullish momentum without an overbought reading |
Above spot, 1.1600 gives way to the 200-day SMA near 1.1630, and only past that does the May 29 high at 1.1685 come into view. That long-term average has barely moved in weeks, which describes a market without directional conviction rather than one in an established uptrend.
RSI at 63 leans bullish and still has room before overbought territory, but price is carrying more information than momentum studies here. A sustained close through the 1.1600 to 1.1635 band, where the round number, the 200-day average and the upper band converge, would confirm more than any oscillator reading.
The euro’s contribution has been supportive rather than assertive.
Second-estimate Q2 GDP confirmed growth of 0.4% quarter-on-quarter and 1.0% year-on-year, and the trade balance returned to surplus in June after three months in deficit. July’s final composite PMI then rose to 52.0 from 50.0, the first expansion since March and the strongest reading in eight months, driven by services climbing back to 51.7 from 49.4.
Output and new orders grew at their fastest rates since last November, and employment stabilised after six months of losses. Inflation is also drifting the wrong way for doves, with euro area prices up 2.9% in July from 2.8% in June and core at 2.5%.
Having paused in July after June’s quarter-point move, the ECB is now expected to go again: a Reuters poll taken from 10 to 13 August found 57 of 69 economists looking for a rise in the deposit rate from 2.25% to 2.50% in September, against 72% support before the July meeting.
The Fed’s 3.50% to 3.75% range still leaves the policy gap 125 to 150 basis points in the dollar’s favour, but the market is pricing compression from both ends.
What Europe cannot yet supply is scale. The PMI points to quarterly GDP growth of just 0.3%, the same poll forecasts 0.2%, and cooling survey price gauges give the ECB room to wait. Europe is doing enough to stop the euro falling, not obviously enough to push it through 1.1630.
The clearest threat to the breakout is not soft European data. It is a reminder of how hawkish the Fed remains.
July’s statement passed on a 9-3 vote, with Beth Hammack, Neel Kashkari and Lorie Logan all preferring an immediate quarter-point increase. Minutes from that meeting are published Wednesday. If the discussion reveals a majority closer to the three dissenters than the statement implied, September pricing can climb back toward the mid-40s as quickly as it fell.
Energy cuts both ways here. Continued tension over the Strait of Hormuz supports haven demand for the dollar, capping euro upside independently of rate expectations, while the same conflict lifted euro area energy inflation to 10.0% in July from 8.5% in June.
Higher energy costs weaken the eurozone’s terms of trade and strengthen the case for ECB tightening at once. A de-escalation headline would deflate the dollar’s haven bid and the euro’s inflation premium together, which is why oil-driven moves rarely resolve into clean direction.
Bullish path. A daily close above 1.1600 exposes the 200-day SMA near 1.1630 and the upper Bollinger Band around 1.1635. Clearing that resistance cluster would bring the May 29 high at 1.1685 back into view.
Failed breakout. A close below 1.1570 signals fading immediate momentum rather than a failed move, since a dip through the 100-day average can be noise. The consequential area is 1.1490 to 1.1500, at the Bollinger midline. A break there would mark real deterioration and expose the 50-day average at 1.1465.
Range case. The pair grinds between 1.1500 and 1.1600 into Friday, leaving the flash surveys to break the deadlock.
Chief Economist Philip Lane speaks in Dublin at 11:30 CET on Monday on Europe’s defence build-up, with the text to be published, and appears again on Tuesday at 13:45 CET on monetary policy in a fragmented world.
Wednesday is dense. Christine Lagarde joins a global economic outlook panel in Geneva at 09:10 CET. Eurostat publishes full July HICP for the euro area and member states, confirming or revising the 2.9% flash estimate, and the ECB releases its separate seasonally adjusted HICP dataset at 12:00 CET. The FOMC minutes follow that evening.
Friday carries the load: flash French and German PMIs at 07:15 and 07:30 UTC, the eurozone composite at 08:00 UTC and the US equivalent at 13:45 UTC. The ECB also publishes its Consumer Expectations Survey and the indicator of negotiated wage rates, a direct input into the services inflation debate.
Monday tests whether Friday’s dollar selling has staying power. Wednesday tests whether the market has turned too dovish on the Fed. Friday tests whether European activity can add a second leg to the move. A breakout does not require the European answer, since further US weakness could carry it alone, but a move standing on both sides of the pair would be far more durable than one standing on dollar softness.