Published on: 2026-07-30
USD/PLN traded near 3.7663 on 30 July 2026, down about 0.12% for the session. The dollar-złoty pair has retreated from its 2026 high of 3.8063, set on 23 July, but remains roughly 5.1% higher for the year after bottoming at 3.4933 on 27 January.
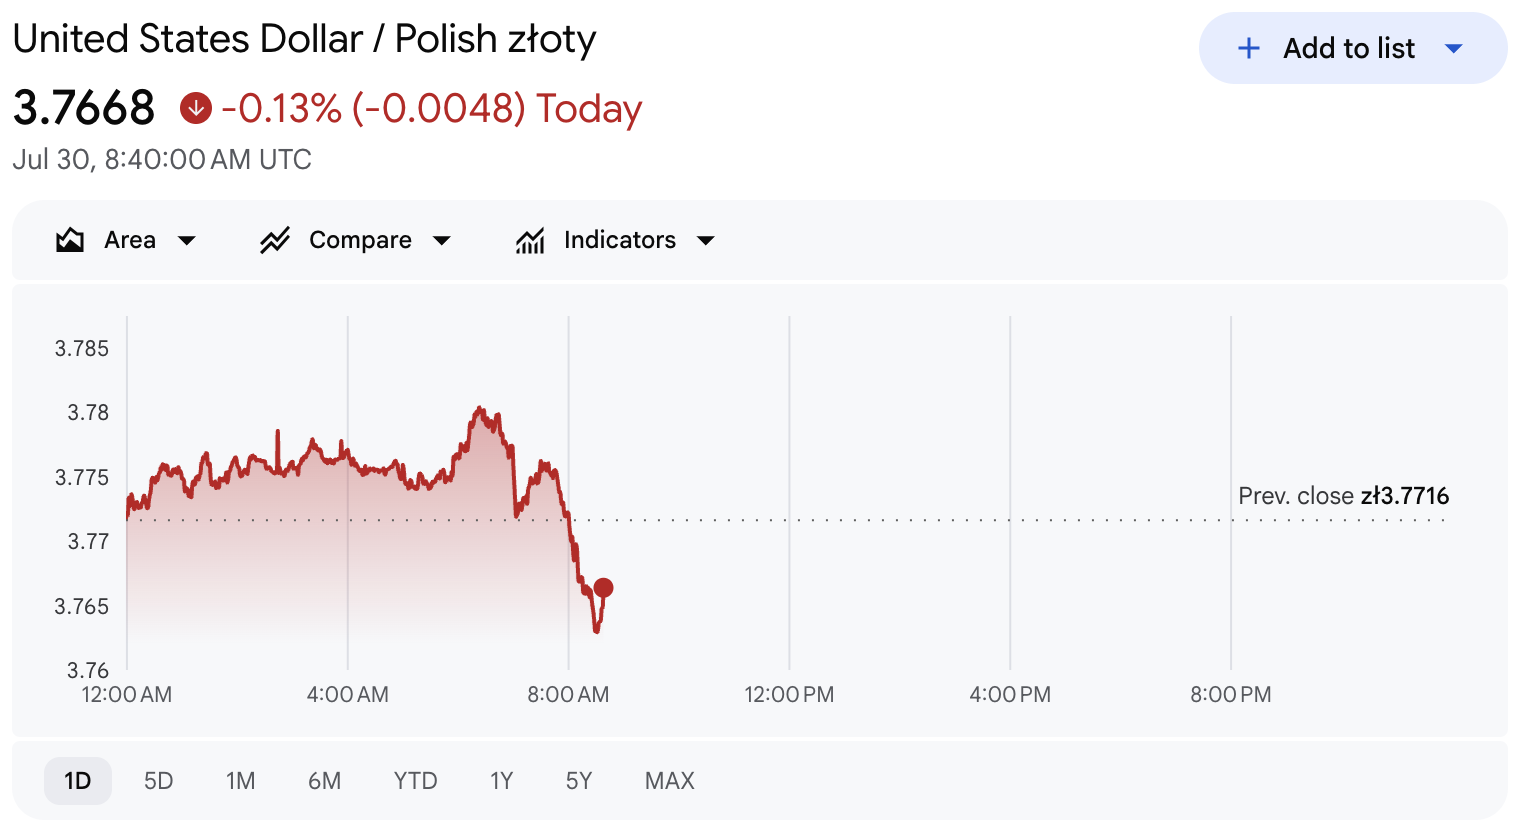
Two technical pictures now compete. The immediate move is bearish and increasingly stretched to the downside, while the wider 2026 advance still favours the dollar. That advance only comes under real pressure if the 3.7324–3.7500 zone fails.
USD/PLN sits below all 12 listed simple and exponential moving averages.
RSI has fallen to 29.33, with Stochastic RSI, Williams %R and CCI also oversold.
MACD, rate of change and bull/bear power remain negative, leaving a rebound possible but unconfirmed.
Immediate support lies at 3.7660 and 3.7618, followed by 3.7500 and 3.7324.
The bearish setup weakens above 3.7732, but repairing the short-term trend requires 3.7900–3.7950.
| Indicator | Reading | Interpretation |
|---|---|---|
| Price | 3.7663 | Below the pivot and all listed averages |
| RSI (14) | 29.33 | Oversold |
| Stochastic (9,6) | 52.54 | Neutral |
| Stochastic RSI (14) | 15.82 | Oversold |
| MACD (12,26) | -0.006 | Bearish momentum |
| ADX (14) | 23.85 | Moderate trend strength |
| Williams %R | -94.70 | Deeply oversold |
| CCI (14) | -259.14 | Deeply oversold |
| ATR (14) | 0.0048 | Subdued short-term volatility |
| Highs/Lows (14) | -0.0053 | Bearish |
| Ultimate Oscillator | 36.98 | Bearish |
| Rate of Change | -0.225 | Negative momentum |
| Bull/Bear Power | -0.0155 | Sellers remain in control |
Analyst classifies the setup as “Strong Sell,” with all 12 moving averages and seven oscillators reading bearish. The counterweight is how far the move has travelled: with RSI below 30, Stochastic RSI below 20, Williams %R near -95 and CCI below -200, fresh short positions carry an elevated risk of being caught by a corrective rebound.
Two notes on method. Every reading above comes from one live intraday snapshot taken at 08:17 UTC and should not be combined with daily or weekly signals, which can differ. And because spot forex trades over the counter rather than on a single centralised exchange, no market-wide volume figure exists; platform tick volume can help confirm a breakout, but only when compared consistently against the same source.
The pair is below the five-period SMA and EMA at 3.7734 and 3.7723, and below the 10-period readings at 3.7744 and 3.7754. Those margins are narrow, so the fastest averages are the first that a bounce would reclaim.
Resistance thickens further out. The 20-period averages stand at 3.7811 and 3.7797, the 50-period at 3.7924 and 3.7876, the 100-period at 3.7936 and 3.7917, and the 200-period at 3.7947 and 3.7926. That produces a continuous band from roughly 3.7797 to 3.7947, with five of the six 50-, 100- and 200-period readings packed into its upper third.
Compression matters more than any single line. A rebound into the band can be absorbed at several levels in succession, which is why the first hurdle, the central pivot at 3.7732, carries less weight than a daily close above the 3.7900–3.7950 convergence.
RSI at 29.33 has entered the conventional oversold zone, and Stochastic RSI at 15.82, Williams %R at -94.70 and CCI at -259.14 are more stretched still. That combination raises the odds of consolidation or a technical bounce while the pair holds above 3.7618. It is a condition rather than a signal, though: trends can hold oversold readings for extended periods when several momentum measures agree.
They do agree here. MACD remains negative at -0.006, rate of change stands at -0.225, bull/bear power is -0.0155, and the Ultimate Oscillator at 36.98 sits below its neutral midpoint. None of these has begun to hook higher, which is the distinction between an oversold market and a turning one.
ADX at 23.85 credits the decline with moderate strength without describing a powerful trend. ATR at 0.0048 points to restrained volatility, the reading most likely to change quickly around a major data release.
The classic pivot system anchors the central pivot at 3.7732. USD/PLN had already broken first support at 3.7690 and was testing second support near 3.7660 at the snapshot time, leaving 3.7618 as the next intraday floor. A sustained break beneath it would expose 3.7500, a psychological level near the lower edge of the July range.
| Level | Type | Significance |
|---|---|---|
| 3.7660 | Second pivot support | Being tested at the snapshot time |
| 3.7618 | Third pivot support | Next intraday floor |
| 3.7500 | Psychological support | Near the lower edge of the July range |
| 3.7324 | 23.6% Fibonacci retracement | Key level preserving the 2026 uptrend |
| 3.6867 | 38.2% Fibonacci retracement | Deeper downside target if 3.7324 fails |
The medium-term map comes from Fibonacci retracements of the 2026 advance from 3.4933 to 3.8063. The 23.6% retracement sits near 3.7324 and the 38.2% retracement near 3.6867. Holding 3.7324 keeps the rise from January intact; losing it opens the deeper level.
Upside resistance runs through 3.7690, 3.7732, 3.7762, 3.7804 and 3.7834 before the moving-average band takes over. Above 3.7950, the 2026 high at 3.8063 becomes the breakout level.
The Federal Reserve held its target range at 3.50%–3.75% on 29 July, though three policymakers voted for a quarter-point increase. That split keeps US yields and September expectations at the centre of the dollar outlook.
Poland’s reference rate also stands at 3.75% after the NBP left policy unchanged in July. Polish inflation slowed to 2.5% in June, matching the midpoint of the central bank’s target, and the NBP projects 3.7% GDP growth for 2026. The rate advantage Poland previously held over the US has largely disappeared.
The next scheduled catalyst is advance US second-quarter GDP alongside the June Personal Income and Outlays report at 12:30 UTC on 30 July. Stronger growth or inflation readings could lift USD/PLN back through 3.7732 toward 3.7804, while softer figures would leave 3.7618 and 3.7500 exposed.
Three paths follow from the chart. While the pair trades below 3.7732, the bias stays bearish, and a break under 3.7618 would favour 3.7500 with 3.7324 the extension. A bounce that stalls between 3.7732 and 3.7804 would keep the existing sell-the-rally structure in place. A sustained move above 3.7950 would invalidate the near-term setup and reopen 3.8063.
The level that decides between a pullback and a genuine change of trend is 3.7324. Above it, this remains a correction inside a dollar uptrend that began in January, however stretched the intraday oscillators become. For traders who are interested in