Published on: 2026-07-20
Updated on: 2026-07-20
Verdict: EUR/JPY spent July locked in a tightening range between roughly 184 and 186. Spot is holding in the mid-185s, above its major moving averages but capped repeatedly at the 186 ceiling. The bias is mildly constructive, but this is a range to be respected until price resolves it, not a trend to chase.
EUR/JPY is trading around 185.5 in the second half of July 2026. The pair spent the month oscillating in a narrow band, with a weekly range of roughly 184.39 to 186.00 and a broader July span from the low-184s to just under 186.
Volatility has been muted, with 30-day readings near 0.3%, and momentum has stayed neutral throughout. That combination, a firm floor and a sticky ceiling, defines the July chart. Back in June, EUR/JPY had already lost momentum below 184.60, leaving 185.30 as the level buyers needed to reclaim.
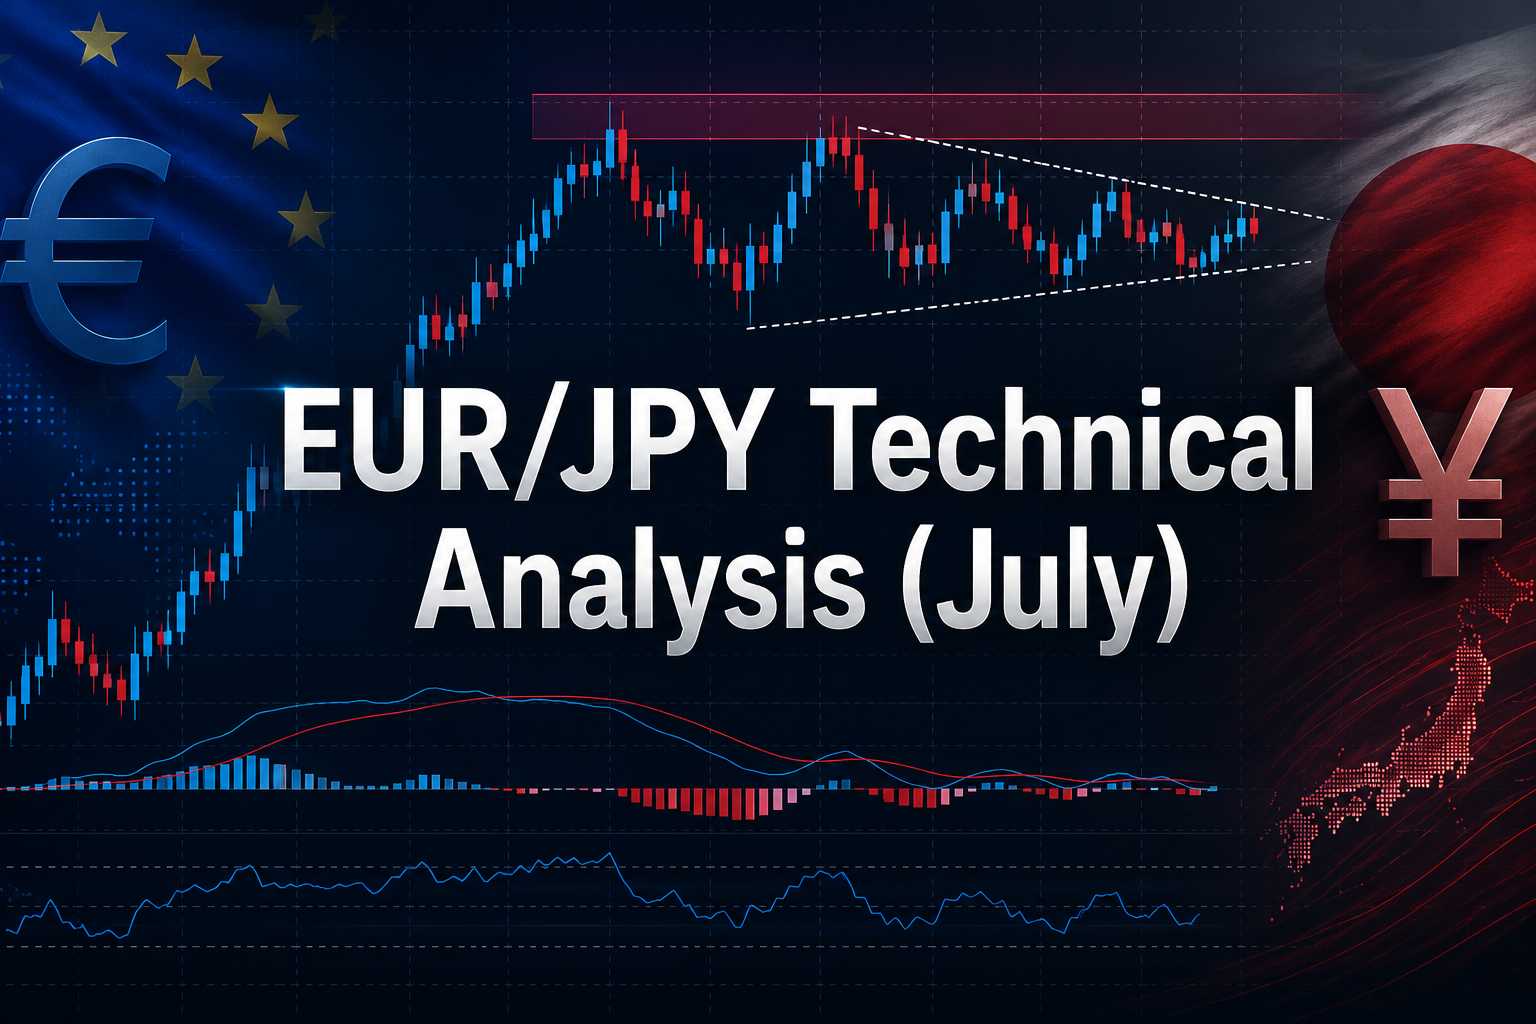
The month has been a story of compression. Early in July the pair based in the low-184s, dipped toward 184.19 on 2 July, then worked steadily higher, tagging 185.68 on 8 July and 185.60 on 9 July before easing back.
By mid-month it was consolidating around 184.65 on 13 July, then firmed again into the 185.99 high printed on 16 July.
The takeaway is that every push toward 186 has been sold, and every dip toward the mid-183s has been bought. Price has repeatedly failed to close above the 186 handle, while 183.50 has held as the floor. The result is a coiling range rather than a directional move, and the longer it persists, the sharper the eventual break tends to be.
On the daily chart, the structure is quietly constructive. Spot is trading above its 50-day simple moving average, sitting around 185.5, and comfortably above the 200-day SMA near 183.8.
That places the medium-term trend on the buyers’ side. The near-term picture is more contested: through mid-July the pair was wrestling with the 100-day SMA and the 20-day Bollinger midpoint clustered in the 184.80 to 184.85 zone, and it has since pushed above that cluster into the mid-185s.
Momentum is the piece that keeps this honest. The 14-day RSI has hovered in neutral territory for most of July, printing readings from the high-40s during mid-month softness to around 55 as price recovered.
Neither figure signals an overbought or oversold extreme. MACD readings have flitted either side of zero, consistent with a market in balance rather than one trending hard. In short, the averages lean bullish, but the oscillators are not confirming a breakout.
| Level or Indicator | Reading | Role and Signal |
|---|---|---|
| Major resistance | 187.50–187.70 | April 2026 high zone; comes into play after a confirmed break above 186. |
| Range ceiling | 186.00–186.12 | July highs and upper Bollinger Band; repeatedly rejected. |
| 50-day SMA | Around 185.50 | Medium-term trend support; price is tracking it closely. |
| Spot price | Around 185.50 | Above the 50-day and 200-day SMAs, keeping the structure constructive. |
| Near-term pivot | 184.80–184.85 | 100-day SMA and 20-day Bollinger midpoint; first support on pullbacks. |
| 200-day SMA | Around 183.80 | Long-term trend support below the current price. |
| Range floor | 183.50–183.70 | July lows and lower Bollinger Band; has held on repeated tests. |
| Key support | 183.20–183.35 | Bearish trigger; a daily close below would weaken the structure. |
| Deeper support | 182.00, then 181.25 | Downside reference levels; 181.25 marks the 2026 low. |
| RSI (14-day) | Around 55 | Neutral, with room for price to move in either direction. |
| MACD (12,26) | Near zero | Balanced momentum with no strong directional commitment. |
| 30-day volatility | Around 0.3% | Compressed volatility, increasing the likelihood of a sharper range break. |
The July range is well defined. The ceiling at 186.00 to 186.12, where the month’s highs and the upper Bollinger band converge, needs a daily close above it to reopen the April high zone at 187.50 to 187.70. Until then, rallies into 186 read as corrective rather than confirmed breakouts.
The floor at 183.50 to 183.70 has held on every test, reinforced by the lower Bollinger band. A decisive close below 183.20 to 183.35 would break the range and expose 182.00, then the 181.25 low from earlier in 2026. Inside those rails, 184.80 to 184.85 is the near-term pivot that now acts as first support on pullbacks.
The euro retains a rate advantage. The ECB’s deposit facility sits at 2.25%, the main refinancing rate at 2.40%, and the marginal lending facility at 2.65% after June’s move, with the bank flagging upside inflation risks and refusing to pre-commit to a path. That differential is the structural bid under EUR/JPY.
The yen side is where the July tension lives. The Bank of Japan is holding the overnight call rate near 1.0%, and policymakers have signalled scope for further tightening toward a neutral level closer to 2% if inflation risks build.
Beyond rates, Japan’s Finance Minister Satsuki Katayama indicated in July that the government is pursuing measures involving the Government Pension Investment Fund to make substantially greater investments in Japanese financial assets, a shift some analysts see as potentially more supportive of the yen than direct intervention.
Elevated geopolitical risk through the month has also periodically lifted safe-haven demand for the yen, capping EUR/JPY rallies.
The net effect is a tug of war: carry keeps a floor under the pair, while a more assertive policy posture and periodic risk-off flows keep a lid on it. That balance is exactly what the tight July range reflects.
Intraday and short-term: neutral to mildly bullish while price holds above 184.80.
Range view: the working band is 183.50 to 186.00; trade the edges until one breaks.
Bullish confirmation: daily close above 186.12, targeting 187.50.
Bearish confirmation: daily close below 183.20, targeting 182.00, then 181.25.
The clean read for July is patience over prediction. EUR/JPY is structurally supported, holding above its key averages, but it has been unable to clear 186 and equally unwilling to break 183.50.
With volatility compressed and RSI neutral, the odds favour a decisive move once the range finally gives way, and the direction of that break, confirmed by a daily close, is the signal worth waiting for.
A yen-supportive headline, whether from the BoJ or the GPIF allocation story, is the most likely catalyst for a downside resolution, while a quiet risk backdrop would let the carry advantage carry price through 186. As always, position size and stop placement should be defined before entry.