Published on: 2026-08-11
Updated on: 2026-08-11
AUD/USD traded at 0.7055 after Tuesday’s RBA decision, six weeks into a recovery off the June low and stalled at the level that would confirm it. The 50 per cent retracement of the May to June decline sits at 0.7064, the mid-June high at 0.7088, and the 61.8 per cent retracement at 0.7112. Monday’s high near 0.7075 traded through the first of them intraday, but none has been reclaimed on a daily close.

Beneath spot, the 38.2 per cent retracement at 0.7016 and the 0.7000 handle mark the floor of the advance, with the 200-day average a further 90 pips lower at 0.6925.
The RBA held at 4.35 per cent and kept an explicit threat of a fourth hike in its statement. The chart did not respond. What is left is a narrow band between 0.7000 and 0.7112, and the question of which side breaks.
Spot is holding just above a cluster of moving averages, with the 50-day EMA at 0.7045 and the 100-day SMA at 0.7053 within ten pips of one another. Every retracement below is measured from a single swing, the 0.7269 May high down to the 0.6859 late-June low, a decline of 410 pips.
| AUD/USD Setup | 11 August 2026 |
|---|---|
| Spot | 0.7055 |
| Retracement swing | 0.7269 high to 0.6859 low |
| Resistance | 0.7064, 0.7088, then 0.7112 |
| Support | 0.7016, then 0.7000 |
| 50-day EMA | 0.7045 - spot above |
| 100-day SMA | 0.7053 - spot above |
| 200-day SMA | 0.6925 - primary trend filter |
| RSI, 14-day | 68 - nearing overbought |
| RSI, four-hour | 59 into Monday’s approach, easing toward 50 after Tuesday |
| MACD, daily | Marginally positive |
| MACD, four-hour | Marginally negative |
| Next catalyst | US CPI on 12 August |
The band between 0.7064 and 0.7112 is confluent resistance rather than a psychological round number.
The 50 per cent retracement lies at 0.7064. Monday’s high near 0.7075 traded through it and settled back underneath, which separates touching a level from reclaiming it. The mid-June high at 0.7088 is the last swing high before the breakdown, and the 61.8 per cent retracement at 0.7112 completes the cluster. Roughly 48 pips cover all three.
The 61.8 per cent level carries the most technical weight. A recovery that fails to reclaim it is conventionally classified as corrective, which places 0.7112 on the boundary between a countertrend bounce and something more durable.
One qualification belongs here. The pair has reached this area only once since the breakdown, printing its highest level since 17 June last Wednesday. Resistance rests on the retracement grid and the June high, not on a sequence of recent rejections.
Until AUD/USD closes above 0.7112, the recovery remains corrective within the May to June decline.
AUD/USD rallied from 0.6678 on 1 January to a cycle high at 0.7269 on 13 May, then surrendered 410 pips into late June, bottoming near 0.6859. That low formed on the 200-day average, which stood near 0.6860 at the time and has since risen to 0.6925.
The recovery has produced higher lows throughout. The late-June trough gave way to roughly 0.6956 at the end of July, a low that formed on the 23.6 per cent retracement, and to 0.6998 on 4 August. Price has since reclaimed the 38.2 per cent level at 0.7016, which now sits beneath spot.
Rising lows under horizontal resistance is an ascending structure, and the pair has posted six consecutive weekly gains. The ceiling is the unfinished part. The mid-June high at 0.7088 has not been challenged on a closing basis, so the sequence of lower highs running from the May peak remains intact.
The uptrend from January holds while 0.6925 does. The May to June decline has been half retraced and no further, which is the distinction between a recovery in progress and one that has completed.
Daily momentum is firm and intraday momentum has faded. The 14-day RSI reads near 68, its strongest since the May peak and consistent with a six-week advance, while daily MACD holds marginally above its zero line. The four-hour RSI was near 59 into Monday’s approach and has eased toward the 50 midpoint since Tuesday’s rejection, with four-hour MACD marginally negative.
Daily RSI near 68 shows strong momentum, though the approach toward overbought territory leaves less room for acceleration without a clean price breakout. Readings above 50 keep the recovery structurally intact, and there is no bearish divergence at the daily highs.
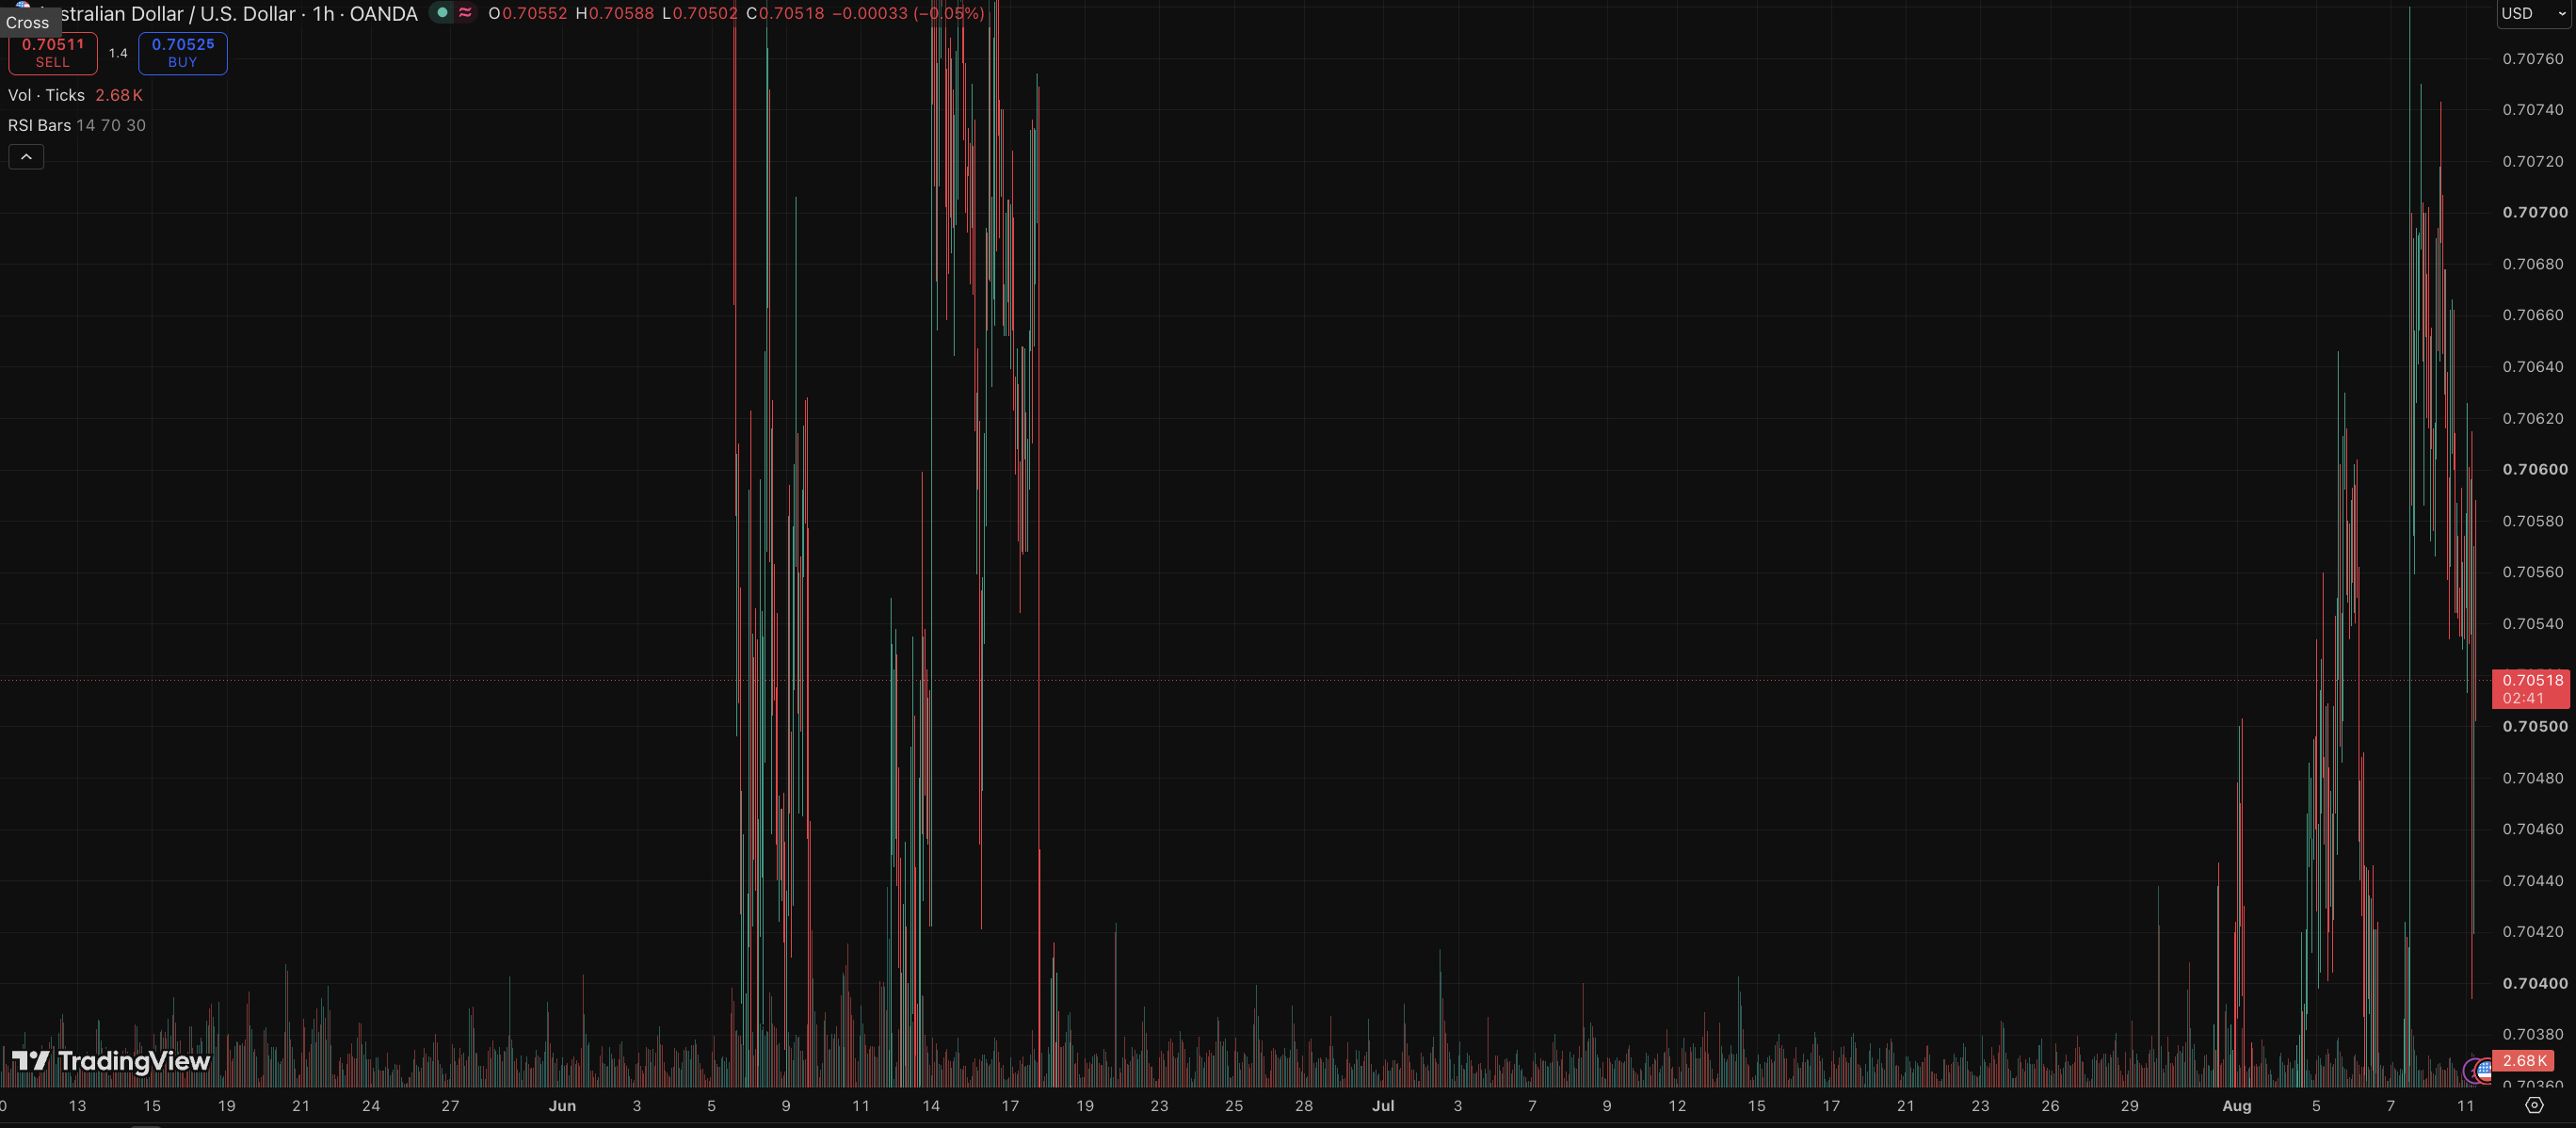
Price action reads the same. The advance has been steady rather than impulsive, and the past week has compressed between 0.6998 and 0.7075.
Three configurations, each with a defined trigger.
Bullish. A daily close above 0.7112 would materially weaken the corrective interpretation and shift focus to the 78.6 per cent retracement at 0.7181, with the cycle high at 0.7269 above it. Closing above 0.7064 and 0.7088 comes first.
Bearish. A daily close below 0.7016 returns the pair to the lower half of the retracement grid, with 0.7000 immediately beneath. Below that, the 23.6 per cent level at 0.6956 and the 200-day average at 0.6925 are the levels deciding whether the January uptrend survives.
Range. Between 0.7000 and 0.7088 the pair stays contained, with the 100-day SMA at 0.7053 as the midpoint. This is the prevailing condition until one side closes outside the band.
| Scenario | Trigger | Objectives | Negated by |
|---|---|---|---|
| Bullish | Daily close above 0.7112 | 0.7181, then 0.7269 | Close back below 0.7064 |
| Bearish | Daily close below 0.7000 | 0.6956, then 0.6925 | Close back above 0.7064 |
| Range | No close outside 0.7000-0.7088 | 0.7053 midpoint | Either boundary breaks |
Ranges break on information, and July US CPI is released on Wednesday.
The mechanism is direct. The print moves US yields, yields move the dollar, and the Aussie trades the differential. A softer reading pressures the dollar and supplies the volatility required for a close through the 0.7064 to 0.7112 cluster. A firmer one revives US rate expectations and puts the 0.7016 retracement and the 0.7000 handle under their first test since early August.
Both boundaries have absorbed intraday breaks during the recovery, Monday’s move through 0.7064 among them, so a wick beyond either carries less technical weight than a daily settlement outside the range.
AUD/USD holds above its 50-day EMA, its 100-day SMA and a rising sequence of lows, and the uptrend from January is intact above 0.6925. The pair has also retraced only half of the May to June decline and has yet to close above the June high.
The recovery fails on a daily close below 0.7000, and structurally on a loss of 0.6925. The corrective reading fails on a daily close above 0.7112. Until one of those prints, the 0.7000 to 0.7088 range remains the operative structure.
Explore AUD/USD with EBC Financial Group and track the next move as US CPI tests the pair’s 0.7000 to 0.7112 range.