Published on: 2026-04-14
Updated on: 2026-04-15
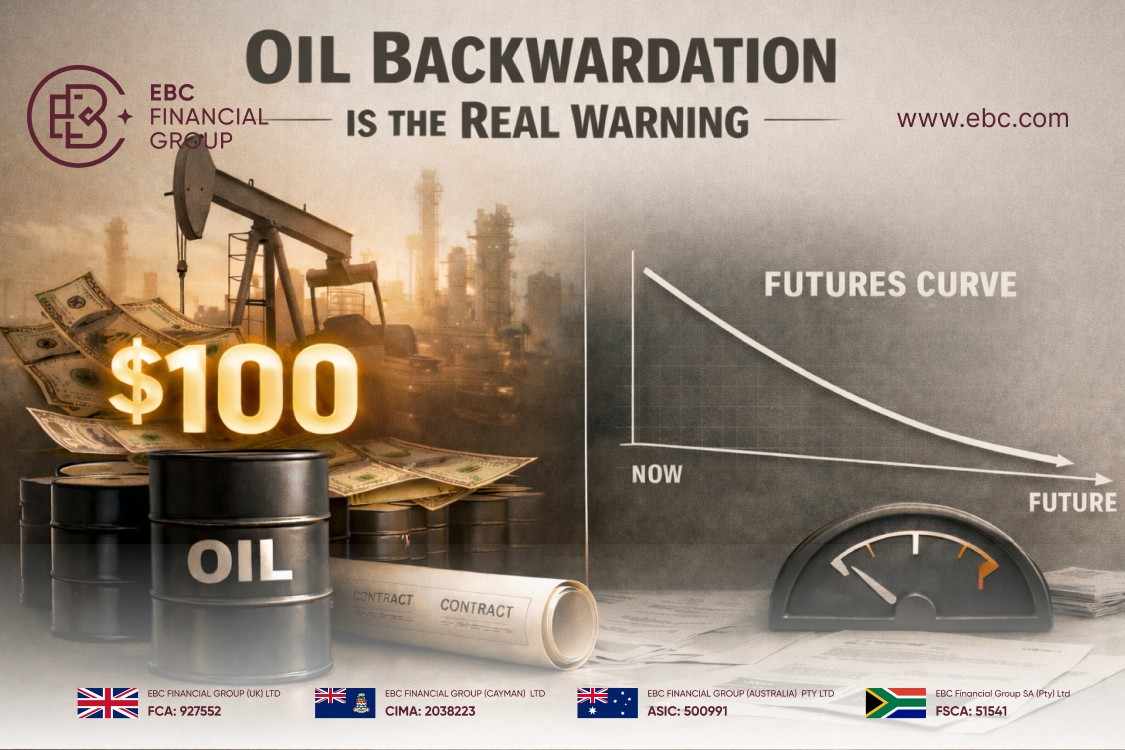
The futures curve structure is more significant than the headline price. Steep backwardation signals acute physical supply stress, not a lasting shift. During the 2026 Hormuz crisis, the back end of the Brent curve stayed in the high $60s to $70s through 2030, even as front-month prices exceeded $100.
Dated Brent and Brent futures are priced separately. On April 7, 2026, Dated Brent hit a record $144.42, while Brent futures traded near $109.27, creating a $35 gap.
Extreme backwardation creates significant economic disparities. Corporations with treasury operations can hedge at lower prices with deferred futures, while households and small businesses must pay the spot price without relief.
$100 crude is a psychological, not structural, threshold. Lasting change is indicated when the long end of the curve rises as the front rises.
Focus on the 1-to-12-month Brent spread instead of the front-month price. A move from steep backwardation to contango, combined with rising inventories and weaker physical differentials, signals a change in supply conditions.

Oil does not trade at a single price. It trades across multiple future delivery dates, and the futures curve often provides more insight than any single price point.
When the curve slopes downward, and oil for immediate delivery costs more than for delivery in six months, this is backwardation. Buyers pay a premium for prompt barrels, reflecting scarcity rather than just risk.
That's the exact condition the oil market found itself in after military action closed the Strait of Hormuz on February 28. Brent crude oil began 2026 at $61 per barrel and ended the first quarter at $118 per barrel. This represented the largest inflation-adjusted quarterly price increase recorded by the U.S. Energy Information Administration (EIA) since 1988.
In March, estimated oil production shut-ins reached 7.5 million barrels per day, rising to 9.1 million barrels per day in April. The market shifted rapidly from manageable backwardation to a severe near-term dislocation. The curve did not just tilt; it buckled.
| Signal | Latest verified read | Market meaning |
|---|---|---|
| Brent front-month, start of 2026 | $61/b | Market entered the year soft |
| Brent front-month, end of Q1 2026 | $118/b | Historic shock repricing |
| Dated Brent, Apr. 7 | $144.42/b | Physical market panic for prompt cargoes |
| Brent futures, Apr. 7 | ~$109.27/b | Paper market priced a smaller shock |
| Jun-26 Brent | $98.41/b | Current front of quoted strip |
| Dec-26 Brent | $80.39/b | Market prices material easing this year |
| Jun-27 Brent | $76.20/b | Further normalization one year forward |
| Dec-30 Brent | $69.85/b | Long-run supply expectations not reset |
| EIA Brent forecast, Q2 2026 | $115/b | Elevated but temporary |
| EIA Brent forecast, Q4 2026 | $88/b | Front-end premium expected to fade |
*Table data compiled from EIA, ICE, and contemporaneous market reporting.
The clearest evidence of this split appeared on April 7, when Dated Brent reached a record $144.42 per barrel and Brent futures were near $109.27, creating a $35 gap between physical and paper markets. By April 9, Dated Brent remained about $27 above June Brent futures.
These two prices share a name but, as energy historian Dan Yergin put it, they describe different worlds.
In the words of Morgan Stanley's commodities strategist Martijn Rats, "Dated Brent reflects what a prompt physical barrel is worth right now in Northwest Europe, while ICE Brent futures are a standardized, centrally cleared contract whose settlement is linked to the forward cargo market." They are connected, but they don't measure the same exposure in the same moment in the supply chain.
The futures market anticipated a brief closure of the Strait of Hormuz, expecting strategic reserve releases and diplomatic resolution to restore flows. The physical market was unconcerned with these expectations; refiners needed immediate supply and were willing to pay $144 per barrel.
Brent crude is quoted at $98.41 for June 2026, $80.39 for December 2026, $76.20 for June 2027, and $69.85 for December 2030. This reflects discounts of $18 per barrel from June to December 2026, $22 from June 2026 to June 2027, and nearly $29 by late 2030. The market expects short-term price pressure, not a sustained $100-per-barrel environment.
The steep front-end premium confirms a physical squeeze, but the market sees no structural change to long-term supply capacity. U.S. shale production remains strong, and non-OPEC output is stable. The market does not view this crisis as altering the long-term oil balance.
Political reflex also suppresses prices. Markets are skeptical of escalation rhetoric, as traders assume threats can be delayed or reversed. This "TACO" mindset explains why paper barrels may underreact compared to physical ones.
Oil prices exceeding $100 per barrel are significant, but this spike does not necessarily indicate a long-term structural change in the market. For example, Brent averaged $100 in 2022 after Russia invaded Ukraine, yet EIA notes that prices rose sharply in the first half of that year and then declined in the second half.
In 2008, Brent peaked near $147.50 before collapsing. EIA data shows the average price fell from $132.72 in July to $39.95 by December. The headline price was real but did not define the market regime.
Today's curve similarly warns against overinterpreting the headline. EIA expects prices to ease later this year, and the Brent strip remains well below the front. The one-day collapse after the ceasefire confirmed much of the front-end move was fear premium, not a reset of long-term supply expectations.
In short, $100 crude alone reveals little. Oil exceeded $100 during this crisis but fell 13% in one day after a ceasefire was announced, as the risk premium unwound. The $100 threshold was never structural; backwardation signaled this throughout.
The most informative indicator is the spread between front-month and deferred contracts, particularly the 1-to-12-month Brent spread.
Currently, the Jun-26 to Dec-26 Brent spread is about $18, and the Jun-26 to Jun-27 spread is about $22. This reflects the market's view that the physical shortage is severe but temporary.
A clearer warning would be a collapse in backwardation toward flat or contango, along with weaker physical differentials. Conversely, a rising long end with elevated front-month prices would signal a different regime. EIA's current forecast favors the first scenario.
.jpg")
Backwardation is not just an intellectual signal; it creates unequal real-world outcomes. Large corporations and institutional investors can act on the deferred futures curve. Airlines, grain merchants, and manufacturers have secured lower prices by buying contracts for late 2026 delivery, locking in rates below current cash-market offers.
For investors holding long futures positions, the curve structure generates returns. As expensive near-term contracts expire and roll into cheaper next-month contracts, traders earn positive roll yield. This contrasts with contango markets, such as during the 2020 COVID collapse, where rolling contracts incurred monthly costs.
However, households and small businesses cannot access the futures curve. They face only the spot price, resulting in higher gasoline, diesel, and heating costs, often immediately and without hedging options.
The same backwardation that benefits large corporations is simply a cost for others. When spot prices significantly exceed deferred prices, holding oil in inventory becomes irrational. Traders are better off selling barrels into the market now than paying storage costs to sit on them.
This acts as a natural circuit breaker in backwardation, drawing inventory out of storage and directing it to refiners, which helps relieve the physical squeeze. The market structure quietly helps alleviate the crisis it signals.
The oil market is effective at distinguishing temporary noise from structural signals. It is not ignoring $100 oil but contextualizing it. Physical Brent indicates scarcity, while the futures curve suggests the shortage is real but temporary.
This is why oil backwardation matters more than the headline price. The key question is not whether Brent will exceed $100 again, but whether backwardation will deepen, persist, or collapse.
Disclaimer: This material is for general information purposes only and is not intended as (and should not be considered to be) financial, investment or other advice on which reliance should be placed. No opinion given in the material constitutes a recommendation by EBC or the author that any particular investment, security, transaction or investment strategy is suitable for any specific person.