Published on: 2026-04-16
Updated on: 2026-04-16
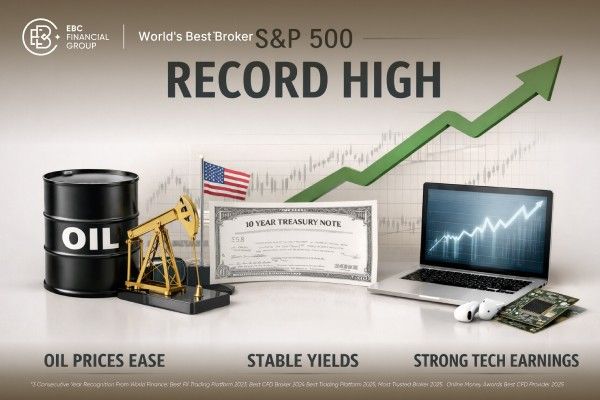
The S&P 500 reached a record high of 7,022.95 after Brent crude oil prices declined from their crisis peaks near $119 to the mid-$90s, easing market concerns about a potential oil shock.
March CPI was hot at 0.9 percent MoM, but the surge was energy-led. Core CPI was only 0.2 percent, which limited the damage to rate-cut hopes and valuation multiples.
The 10-year Treasury yield hovered between 4.26 and 4.28 percent, and the difference between the 10-year and 2-year yields remained positive at 0.53 percentage points, indicating resilience rather than a straightforward recession trade.
S&P 500 Q1 earnings are still expected to rise 13.2 percent, with Information Technology among the strongest sectors, giving the rally a fundamental bridge.
The risk is not that the market has no logic. The risk is that oil remains elevated, momentum is getting stretched, and the rally is still sensitive to any renewed move higher in inflation expectations.
The S&P 500 record high is not a story about the market shrugging off oil, inflation, and rates. It is a story about the market deciding that the oil shock had stopped getting worse fast enough to break the earnings cycle, while Treasury yields remained high but stable enough for long-duration growth stocks to recover.
That logic became evident in the mid-April table below: oil stayed high, headline inflation flared, market-based inflation expectations rose, but yields and earnings never moved into outright breakdown territory.
| Variable | Latest reading | Why it matters |
|---|---|---|
| S&P 500 close | 7,022.95 on April 15 | Confirms the market fully reclaimed the January record. |
| Nasdaq move | +1.6% on April 15 | Shows the record was led by growth and duration-sensitive equities. |
| Brent crude | $94.93 on April 15 | Still inflationary, but no longer at panic highs. |
| Brent war peak | $119 cited during the height of stress; daily prices nearly $128 on April 2 | Proves the equity rally followed a cooling of the oil shock, not its disappearance. |
| March CPI | +0.9% m/m, +3.3% y/y | Headline inflation re-accelerated. |
| March core CPI | +0.2% m/m, +2.6% y/y | Core held in enough to stop a full valuation collapse. |
| 10-year Treasury yield | 4.26% on April 14; 4.28% on April 15 | High, but not disorderly. |
| 10Y-2Y spread | +0.53 on April 15 | Suggests the market is pricing resilience, not an imminent hard landing. |
| 5Y breakeven inflation | 2.61% on April 15 | Best compact measure of inflation expectations in the market. |
| Q1 S&P 500 earnings growth estimate | 13.2% | Keeps the rally tied to fundamentals, not just multiple expansion. |
| Technology sector weight in SPY | 33.99% | Explains why tech leadership can drag the full index higher. |
In short, the S&P 500's record rally was not built on easy macro conditions; it was built on stabilization.

The first answer is that the market was trading the direction of the oil shock, not just the level. Brent crude remained elevated at $94.93 on April 15, but the more important information was that it had fallen sharply from the early-April spike.
The EIA said Brent averaged $103 in March and reached almost $128 on April 2. Once that trajectory broke, equities no longer had to price an endlessly worsening inflation impulse.
That shift matters because oil enters equities through multiple channels. It raises transport and input costs, pushes up gasoline, lifts headline inflation, and then bleeds into inflation expectations. The March CPI report captured exactly that pattern. The all-items index rose 0.9 percent on the month and 3.3 percent on the year, while the energy index jumped 10.9 percent and gasoline surged 21.2 percent, accounting for nearly three-quarters of the monthly CPI increase.
Yet the same report also showed why stocks could recover. Core CPI, which strips out food and energy, rose only 0.2 percent in March and 2.6 percent over 12 months. That kept the inflation shock narrow enough for equities to treat it as an energy spike rather than a full regime change in prices.
The S&P 500 record high, therefore, reflects a market betting that inflation pressure remains concentrated, not a market pretending inflation no longer exists.
The second answer is that yields were restrictive and not destabilizing. The 10-year Treasury yield rose to 4.279 percent on April 15 from 4.255 percent the day before. That is not low enough to be friendly to equities in a classic sense. But it is also not the type of violent repricing that normally crushes growth stocks. In other words, bond yields were a headwind, not a market breaker.
The curve also sent an important signal. The 10Y-2Y spread stood at 0.53 percentage points on April 15, up from 0.50 the day before. A positive slope at that level is not a sign of a recession. It is a market that continues to experience nominal growth and inflationary risks. That matters for the equity narrative because it means a collapse in growth expectations did not drive the record high. It was driven by confidence that growth could absorb the energy shock better than feared.
The cleaner market gauge was breakeven inflation. The 5-year breakeven rate rose to 2.61 percent on April 15 from 2.58 percent on April 10. That confirms the oil shock did lift inflation expectations. But the move stayed within a range consistent with elevated, not unanchored, inflation.
As long as breakevens rise more slowly than oil spikes, the equity market can keep treating crude as a shock to be discounted rather than a permanent reset of valuation math.
The third answer is that tech was not merely the beneficiary of better sentiment. It was the transmission mechanism through which a stabilizing macro backdrop turned into index gains.
FactSet's Q1 preview on April 2 showed the S&P 500 entering earnings season with expected earnings growth of 13.2 percent and revenue growth of 9.7 percent. Nine of the eleven sectors were projected to post year-over-year earnings growth, led by Information Technology, Materials, and Financials.
That strength did not disappear once reporting began. By April 10, FactSet's blended earnings growth rate had eased to 12.6 percent, but it still implied the sixth straight quarter of double-digit earnings growth for the index. Information Technology is projected to be the strongest sector, with an anticipated profit growth of 45 percent, primarily driven by semiconductors. The sector's expected net margin of 28.9 percent also stood far above its five-year average.
That is the underappreciated link in the chain. High oil can hurt margins. Higher yields can pressure multiples. But if the largest earnings engine in the index is still producing double-digit growth and regaining internal breadth, the S&P 500 can reach a record high even in an imperfect macro environment.

The S&P 500's record high says the market believes the worst-case oil path has been interrupted. It says core inflation has not yet validated a broader inflation spiral. It says Treasury yields are high but not high enough to overwhelm the index's dominant profit centers. And it says the market still trusts corporate earnings more than it fears a one-month energy shock.
What it does not say is that the macro backdrop has turned benign. Brent remains near $95. The 5-year breakeven is still above 2.6 percent. The 10-year yield is still near 4.3 percent. Those are not soft conditions. They only stopped deteriorating quickly enough to prevent growth stocks from recovering.
The next test is straightforward. If oil rises again without dragging breakevens and long yields much higher, the market can continue to climb on earnings. If crude starts feeding into broader price measures and pushes yields into a sharper repricing, the valuation cushion beneath tech narrows quickly. The chain is still intact, but it is not immune.
The market's fault lines are equally visible in the data below. These are the variables that would turn a contained energy shock into a broader equity problem.
| Risk trigger | What would change | Market implication |
|---|---|---|
| Oil re-accelerates | Brent pushes back toward crisis highs | Headline inflation pressure returns fast |
| Core inflation broadens | Energy shock leaks into services and goods | Fed and bond markets reprice more aggressively |
| Breakevens break higher | 5-year inflation expectations move beyond current range | Equity multiples compress |
| 10-year yield jumps sharply | Rates move from restrictive to destabilizing | Long-duration tech loses support |
| Earnings guidance weakens | Tech and financials fail to sustain Q1 momentum | Record high loses its fundamental bridge |
Because the market reacted to the cooling of the oil spike, not the disappearance of energy inflation.
No. Tech struggles most when yields rise abruptly, forcing a sharp repricing of discount rates.
They matter in sequence. Oil is the shock variable, breakevens and Treasury yields are the transmission mechanism, and earnings determine whether the index can absorb the pressure.
The S&P 500's record high is best understood as a chain reaction. Oil stopped worsening fast enough to keep inflating macro fear. Inflation expectations increased, but not to a point that would cause a chaotic repricing of bonds.
Yields stayed restrictive, not destructive. Technology remained the largest earnings and weighting driver of the index, helping the market reach a new record.
And for now, that mechanism still depends on one condition holding: stabilization is enough, as long as it does not reverse.
Disclaimer: This material is for general information purposes only and is not intended as (and should not be considered to be) financial, investment or other advice on which reliance should be placed. No opinion given in the material constitutes a recommendation by EBC or the author that any particular investment, security, transaction or investment strategy is suitable for any specific person.