Published on: 2026-04-07
Updated on: 2026-04-07
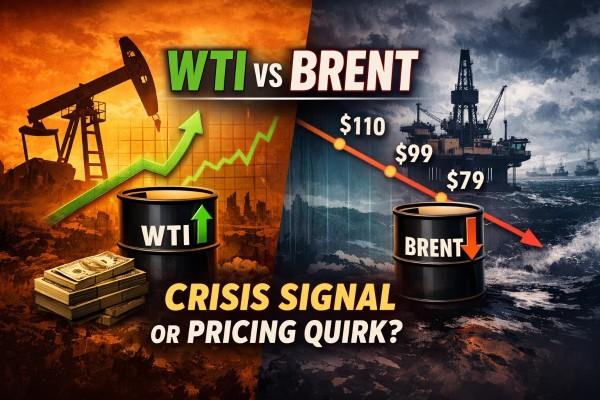
In early April 2026, front-month WTI traded above front-month Brent for the first time in about four years, but the move reflected contract timing and extreme prompt tightness rather than a clean benchmark reversal.
Currently, the WTI-Brent price inversion should be viewed as an anomaly, rather than as evidence that Brent has lost its global premium.
Same-month pricing still points to Brent scarcity. On April 6, June Brent was priced at $107.95, while June WTI was at $96.36, resulting in Brent having an $11.59 premium on a like-for-like basis.
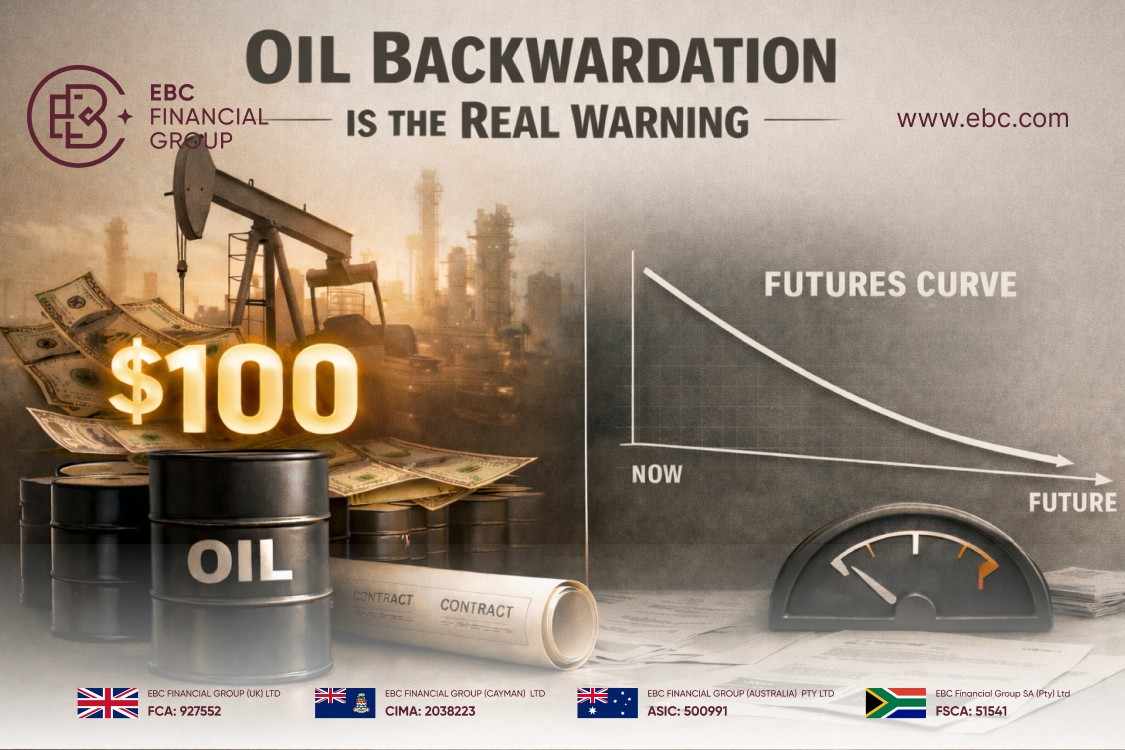
The cleaner crisis signal is in the futures curve. ICE data showed Jun-26 Brent at $109.11, Jul-26 at $99.25, and Dec-26 at $79.92, a steep backwardation that suggests immediate supply stress rather than a stable benchmark repricing.
Physical-market indicators still favor Brent. EIA weekly spot data showed a $16.95 Brent premium for the week ending March 27, while Cushing stocks rose to 31.465 million barrels from 22.840 million on January 2, which does not fit a classic inland shortage narrative.

Typically, Brent trades $2–5 per barrel above WTI, reflecting its status as the global seaborne benchmark and WTI's landlocked position in Cushing, Oklahoma. This discrepancy arises from transportation expenses, access to refineries, and geographical factors in the trading and storage of crude oil.
Traders often use the Brent-WTI spread to gauge oil-market stress, but that shortcut broke down in early April 2026. The apparent inversion mostly compared May WTI with June Brent, while like-for-like pricing still showed June Brent at $107.95 and June WTI at $96.36 on April 6.
Despite this, Brent remains a rarer global commodity. The headline inversion is genuine, but delivery timing and a sharp premium for prompt supply are distorting the signal.
WTI futures are tied to delivery at Cushing, Oklahoma, while Brent futures use a different delivery and settlement setup. In a market that is paying heavily for prompt barrels, nearby contracts can stop behaving like simple benchmark labels and start behaving like urgent supply instruments.
This is why the front-month inversion appears dramatic while like-for-like pricing still favors Brent: on April 6, June Brent traded at $107.95 and June WTI at $96.36.
Brent's forward strip is sending a clearer message than the headline spread. June Brent at $109.11, July at $99.25, and December at $79.92 implies that buyers are paying up for immediate cargoes, not that the market has permanently decided WTI deserves a premium to Brent.
In plain terms, the market is screaming about timing, not rewriting the benchmark hierarchy.
U.S. crude oil production reached a record 13.6 million barrels a day in 2025, and crude exports still averaged 4.0 million barrels a day despite an annual decline. That keeps WTI closely tied to global flows rather than trapped at Cushing.
Europe also became more important after West Texas Intermediate (WTI) Midland was incorporated into the Dated Brent complex for June 2023 deliveries. This has strengthened the link between U.S. barrels and seaborne benchmark pricing.

The answer is both, but the two signals are not equally important. The headline parity is largely a pricing quirk caused by comparing different contract months, while the broader curve and the physical market still point to genuine supply stress.
If parity alone were the crisis signal, same-month Brent would also be trading below WTI, and spot Brent would not still carry a wide premium. Neither condition holds. Brent continues to lead in like-for-like pricing, and EIA spot data clearly indicates a physical premium for Brent over WTI. That weakens the case that the global benchmark relationship has broken.
However, market structure still indicates a real stress event. ICE data showed Jun-26 Brent at $109.11, Jul-26 at $99.25, and Dec-26 at $79.92, which is an unusually steep backwardation. That pattern suggests buyers were paying sharply up for immediate barrels, not repricing WTI into a durable premium benchmark over Brent.
A second check is inventories. Cushing crude stocks rose 37.8 percent from 22.840 million barrels on January 2 to 31.465 million on March 27. That is not what a deep inland supply failure looks like. It indicates that the WTI premium is influenced by prompt-futures dynamics and export options, rather than a permanent shortage in the U.S. storage hub.
A third factor is import exposure. In 2025, countries in the Persian Gulf provided 490,000 barrels of crude oil per day to U.S. imports, while the total average of U.S. crude imports was 6.169 million barrels per day. This means that the Persian Gulf accounted for approximately 8% of the U.S. crude import mix.
Consequently, markets tied to Brent crude are inherently more susceptible to maritime disruptions and freight-related risks. Thus, a true physical crisis should first be reflected in Brent pricing, even if front-month WTI trades above it temporarily.
The snapshot below focuses on confirmed market structure rather than vendor-specific technical indicators.
| Measure | Verified reading | Interpretation |
|---|---|---|
| Front-month settlement, April 2 | WTI $111.54 vs Brent $109.03 | Front-month inversion was real, but contract timing distorted the comparison |
| Same-month comparison, April 6 | June Brent $107.95 vs June WTI $96.36 | Like-for-like pricing still showed Brent at a premium |
| Weekly spot differential, week ended March 27 | Brent minus WTI +$16.95 | Physical market pricing continued to favor Brent |
| Brent forward curve | Jun-26 $109.11, Jul-26 $99.25, Dec-26 $79.92 | Steep backwardation pointed to near-term supply tightness |
| Cushing stocks, March 27 | 31.465 million bbl | Inventory levels did not indicate a clear inland storage squeeze |
| U.S. crude production, 2025 | 13.6 million b/d | Domestic supply remained structurally strong |
| U.S. crude exports, 2025 | 4.0 million b/d | WTI remained more globally linked than in prior cycles |
| U.S. Persian Gulf crude imports, 2025 | 490,000 b/d | Direct U.S. Gulf exposure remained limited relative to Brent-linked markets |
For this article, curve shape, contract timing, and physical differentials are more reliable than RSI or MACD figures.
Not by itself. The cleaner crisis clues are extreme backwardation, prompt-delivery premiums, and disruptions to seaborne flows.
Because contract timing matters. Nearby futures can reflect urgent delivery demand, while spot and same-month pricing capture the broader physical relationship.
It can last for short stretches during sharp prompt squeezes, but a durable regime change would require the same-month and spot markets to keep WTI above Brent. The current data does not indicate that yet.
The WTI-Brent parity can be easily misinterpreted if it is considered solely as a measure of crisis. In early April 2026, the stronger signals came from prompt-delivery premiums, the shape of the Brent curve, and the continued Brent premium in same-month and weekly spot pricing.
That leaves the headline inversion looking less like a structural regime change and more like a distorted signal created by a very tight prompt market.
Disclaimer: This material is for general information purposes only and is not intended as (and should not be considered to be) financial, investment or other advice on which reliance should be placed. No opinion given in the material constitutes a recommendation by EBC or the author that any particular investment, security, transaction or investment strategy is suitable for any specific person.