Published on: 2026-05-28
Updated on: 2026-05-28
The Ichimoku Cloud is a tool that helps traders see trend direction, momentum, support, and resistance on a single chart. It uses several lines together, so traders can quickly tell if buyers or sellers are in control.
Traders like the Ichimoku Cloud because it gives quick context. It shows if the price is trending, moving sideways, losing momentum, or nearing an important level. At first, it might look busy to beginners, but once you learn each part, it becomes a useful way to read the market.
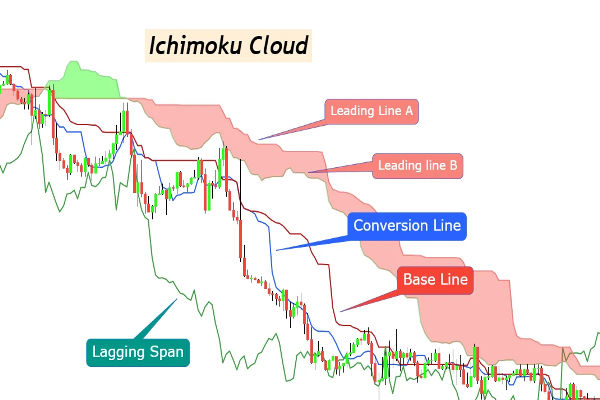
A standard Ichimoku Cloud chart has five lines. Two lines form the cloud, and the other three help confirm the trend's momentum and strength.
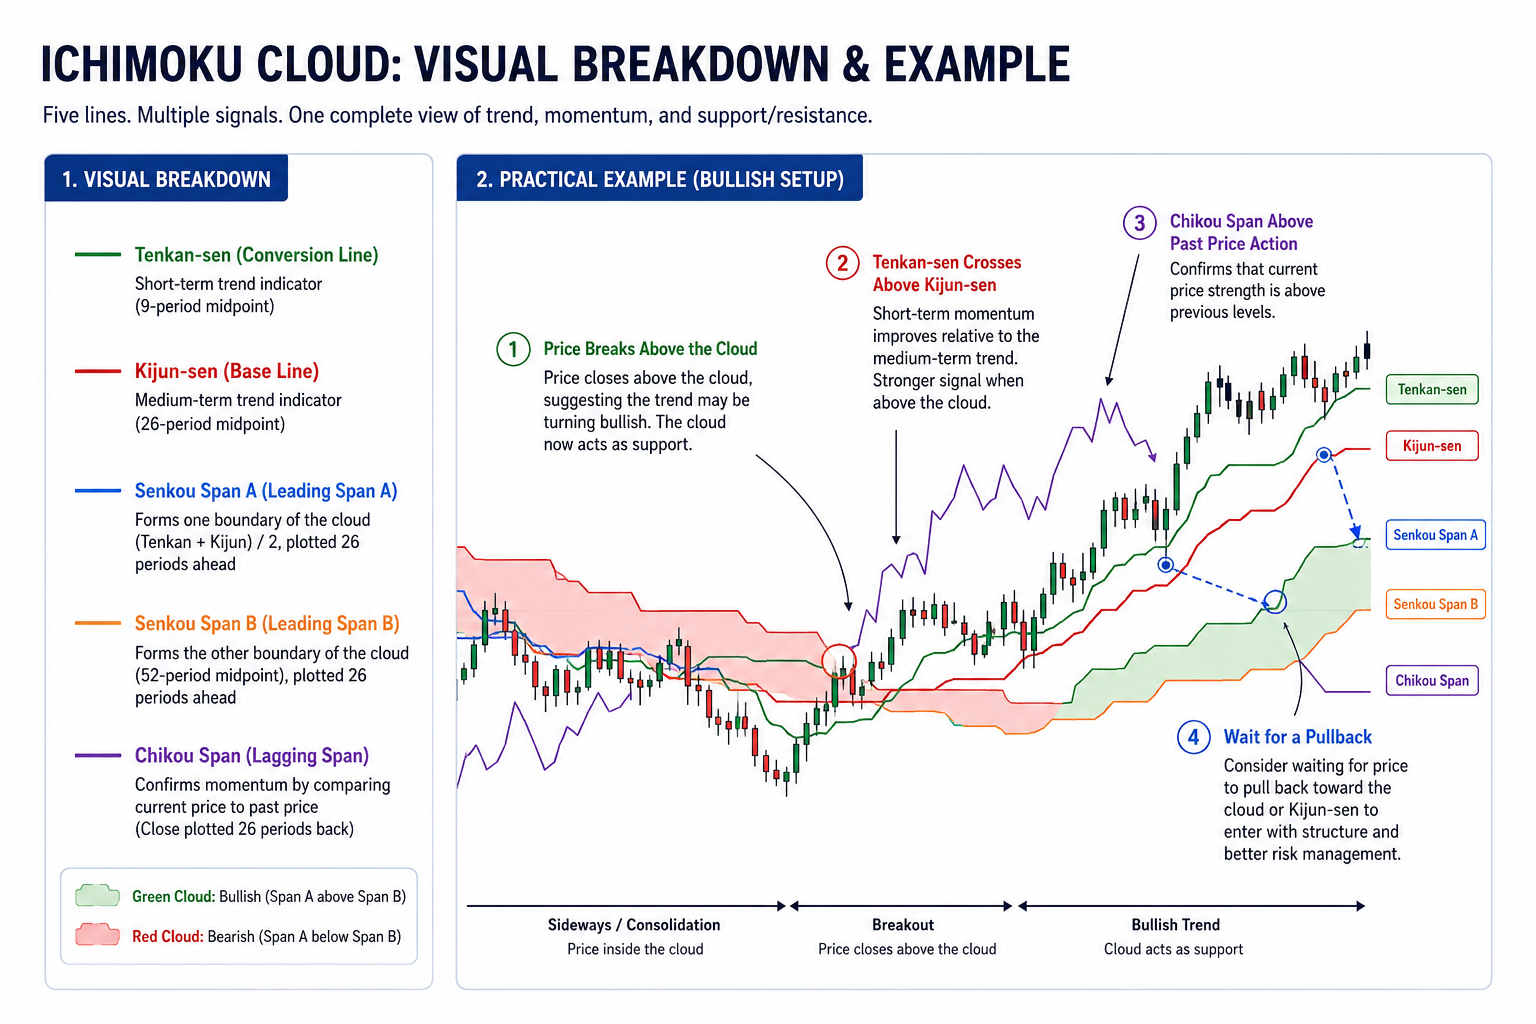
Let’s say a currency pair has been moving sideways and then breaks above the Ichimoku Cloud. When the price closes above the cloud, it can mean the overall trend is turning bullish. The cloud now acts as support instead of resistance. Traders often see this as an early sign that buyers are taking control.
Next, the Tenkan-sen moves above the Kijun-sen. This crossover means short-term momentum is stronger than the medium-term trend. If this happens above the cloud, the signal is usually stronger because the price is already in bullish territory.
The bullish signal becomes even stronger if the Chikou Span is also above its previous prices. This means the current price is not just a short-term jump, but is stronger than earlier market levels.
A trader might wait for the price to pull back toward the cloud or the Kijun-sen before buying. This helps keep the trade planned and avoids buying after a quick move up.
When the price is above the cloud, the market is usually bullish. Buyers are in control, and the cloud can act as support.
Traders often look for pullbacks toward the cloud instead of buying when the price is already high. The best bullish setups occur when the price is above the cloud, the Tenkan-sen is above the Kijun-sen, and the Chikou Span is also above the price.
When the price is below the cloud, the market is usually bearish. Sellers are in control, and the cloud can serve as a counterweight.
In this situation, traders should be careful with bullish signals. A small bounce below the cloud might just be a short-term move in a bigger downtrend.
When the price is inside the cloud, the market is often uncertain. The trend is less clear, and the price might move sideways.
Many traders avoid starting new trend trades when the price is inside the cloud. The cloud is a transition area where buyers and sellers are still fighting for control.
A bullish cloud crossover happens when Senkou Span A goes above Senkou Span B. This can be a sign that the market is getting stronger.
The signal is stronger if the price is already above the cloud. If the crossover happens while the price is inside or below the cloud, traders usually wait for more proof before acting.
A bearish cloud crossover happens when Senkou Span A drops below Senkou Span B. This suggests the market is getting weaker.
The bearish signal matters more when the price is also below the cloud. If the price stays above the cloud, the crossover might just mean a pause, not a full trend change.
A thick cloud indicates stronger support or resistance. The price may need more force to break through.
A thin cloud means support or resistance is weaker. Breakouts can happen more easily, but there may also be more false moves if momentum is weak.
The cloud is not a fixed line. It moves with the price, so it acts as a dynamic support or resistance area.
In an uptrend, the price might fall back toward the cloud before going up again. In a downtrend, the price might rise into the cloud before dropping lower. This makes the cloud helpful for timing when to enter or exit trades.
The Ichimoku Cloud works best in trending markets. When the market moves sideways, it can send mixed signals and lead to more false breakouts.
A Tenkan-sen and Kijun-sen crossover alone is not enough. Traders should also check where the crossover happens compared to the cloud.
Where the price matters. A bullish crossover below the cloud is weaker than one above it. The context makes the signal stronger or weaker.
Buying when the price is far above the cloud, or selling far below it, can lead to poor risk-reward. Waiting for a pullback usually gives a better setup.
The Ichimoku Cloud can help spot market structure, but it does not remove trading risk. Traders still need to manage position size, set stop levels, and have a clear exit plan.
Technical Analysis: A method of studying price charts, patterns, and indicators to understand market behaviour.
Moving Average: A line that smooths price data to show the average price over a selected period.
Support and Resistance: Price areas where buyers or sellers have historically reacted.
Momentum Indicator: A tool that helps measure the speed or strength of price movement.
Trend Following: A trading approach that aims to trade in the direction of the dominant market trend.
Yes, but beginners should learn it one step at a time. The chart can look complicated at first because it has five parts. Once you understand each part, the Ichimoku Cloud is a clear way to see trend, momentum, and support.
You can use the Ichimoku Cloud on many timeframes, but it works better on higher ones like 4-hour, daily, or weekly charts. Lower timeframes often have more noise and weaker signals.
When the price is above the cloud, it usually indicates a bullish market. Buyers are in control, and the cloud can act as support. Traders often look for a Tenkan-sen and Kijun-sen crossover to confirm the signal.
The Ichimoku Cloud can help spot possible reversals, but it is not a prediction tool. Reversals are more reliable when the price breaks the cloud, momentum confirms, and the Chikou Span supports the new trend.
The Ichimoku Cloud gives traders a clear way to read market direction without cluttering the chart with too many indicators. Its main strength is that it combines trend, momentum, and support and resistance into one visual tool.
When the price is above the cloud, buyers are in control. When it is below, sellers are stronger. If the price is inside the cloud, the market has no clear direction. The Tenkan-sen and Kijun-sen show momentum, while Senkou Span A, Senkou Span B, and the Chikou Span give extra context and confirmation.



World's Best Broker