Published on: 2026-05-25
Updated on: 2026-05-25
The silver tsunami is not a bet on older consumers. The real shock is the 80+ population, projected to triple to 426 million by 2050, where care intensity and retirement costs rise fastest.
Retirement math is losing its worker base. Across the OECD, the ratio of people aged 65+ per 100 people aged 20-64 is projected to rise from 33 in 2025 to 52 by 2050.
The market premium sits in dependency compression: diagnostics, prevention, remote monitoring, home care, medtech and AI tools that cut hospital days, staff hours and late-stage care.
Retirement markets are moving from accumulation to income protection. US retirement assets reached $49.1 trillion, while US retail annuity sales hit a record $464.1 billion in 2025.
Senior housing has demand, but not every full building becomes a profitable asset. US senior housing occupancy reached 89.5% in Q1 2026, with labor costs, debt refinancing and affordability deciding the winners.
Ageing is still being priced as demand growth, when the real fault line is payment capacity: pensions, insurers, families and governments are being forced to fund longer lives with fewer workers behind them. The repricing is already visible in record annuity sales, senior housing occupancy approaching 90%, and US pension and Medicare trust funds sitting on the same 2033 full-benefit deadline.

Longer life is now a claim on future cash flow. The global 60+ population is projected to rise from 1 billion in 2020 to 1.4 billion by 2030 and 2.1 billion by 2050, but the number breaking retirement math is smaller and more expensive: the 80+ cohort is projected to triple to 426 million by 2050.
The 426 million figure is not shocking because it is large. It is shocking because the 80+ cohort is where retirement duration, chronic disease, mobility loss, dementia risk, care hours and family dependency concentrate.
Age does not generate profit on its own. It creates invoices. A hospital can have full beds and weak margins if reimbursement lags wages. A senior housing facility can run near capacity and still lose operating leverage if staffing costs, insurance, debt service and regulation absorb rent growth.
The silver tsunami will not reward proximity to old age. It will reward control over the cost curve: fewer hospital days, fewer care hours, later frailty, safer income streams and lower dependency costs. Everything else is exposure without control.

Retirement systems were priced for a world that no longer exists: more workers, fewer retirees, shorter lifespans, cheaper care and families large enough to absorb unpaid support. That model is not bending. It is losing its funding base.
Across the OECD, the ratio of people aged 65+ per 100 people aged 20-64 is projected to rise from 33 in 2025 to 52 by 2050, up from 22 in 2000. The pressure is a cash-flow squeeze: fewer contributors, more beneficiaries and longer claims on pension and healthcare systems.
Solvency comes first. When the funding base weakens, every other ageing trade becomes conditional: healthcare demand depends on reimbursement, senior housing depends on household affordability, retirement products depend on income risk, and automation depends on whether care systems need to replace labor they cannot hire.
Japan is not just a warning label. It is the empirical test. Once ageing became structural, the bill moved into government debt as social security deficits were financed through bond issuance, then into care infrastructure through the 2000 long-term care insurance system, then into automation as a shrinking younger workforce pushed software, robotics and labor-saving investment.
The retirement-income shift is now visible as well. Japan’s individual annuity annualised premium on new policies jumped 156.7% year-on-year in 2023, while policies in force rose for the first time in seven years.
China is the larger test. Its 60+ population reached 310 million by the end of 2024, roughly 22% of the population, with the share projected to reach 30% by 2035. The country is ageing while still trying to repair property wealth, restore household confidence and shift growth toward consumption. The retirement bill is arriving before the consumption engine has fully recovered.
Ageing does not hit markets evenly. It reprices in sequence: public balance sheets first, care capacity second, retirement income third.
Bonds price the bill first. US Social Security’s Old-Age and Survivors Insurance trust fund is projected to pay full scheduled benefits only until 2033, after which continuing income covers 77% of benefits. Medicare’s Hospital Insurance trust fund carries the same 2033 full-benefit deadline. Pension and healthcare promises are now on the same fiscal clock.
Care labor becomes the bottleneck. Ageing raises demand for nurses, aides, therapists, home-care workers and family caregivers while shrinking the labor pool that supplies them. The constraint is not patient demand. It is paid care hours.
Automation becomes margin defense. AI documentation, remote monitoring, triage, scheduling tools and robotics gain value when they reduce staff hours in a system that cannot hire fast enough. The real trade is not healthcare AI. It is labor substitution inside ageing infrastructure.
Retirement income replaces accumulation. US retirement assets reached $49.1 trillion at end-2025, but a larger asset pool does not solve the problems of selling into downturns, withdrawing too quickly, or outliving assets. Record US retail annuity sales of $464.1 billion in 2025 show the product cycle shifting toward income protection.
Bonds absorb the promise. Care systems expose the labor gap. Retirement products turn longevity into an insurance problem.
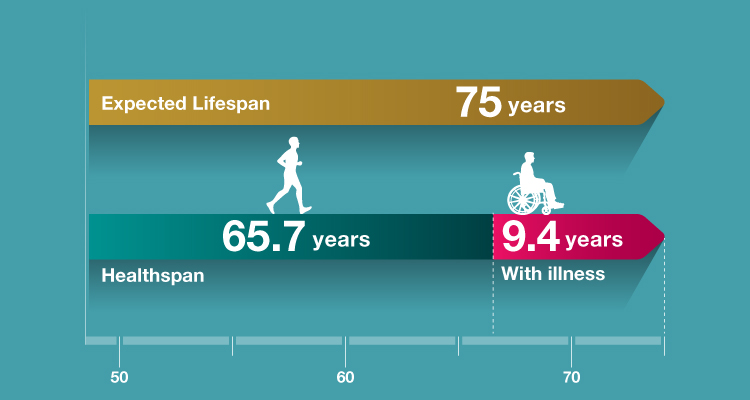
The ageing trade has one brutal valuation line: extra years with productivity are growth; extra years with dependency are liabilities.
Lifespan measures how long people live. Healthspan measures how long they remain functional, productive and financially independent. When the gap widens, pensions pay out longer, hospitals treat more chronic disease, families provide more unpaid care, and governments inherit the funding shortfall.
The IMF estimates that healthy ageing could add about 0.4 percentage point annually to global GDP growth over 2025-2050. That is the price of keeping older populations productive enough to soften the drag from shrinking workforces and rising public debt.
Healthspan is not a wellness slogan. It is the difference between an ageing economy that keeps producing and one that turns longer life into a balance-sheet claim.
The ageing trade splits into two groups: businesses that remove cost from the system, and businesses that absorb cost without controlling the payer.
| Ageing pressure | Gets paid | Gets squeezed |
|---|---|---|
| Chronic disease | Diagnostics, prevention, obesity, diabetes, cardiovascular and dementia care | Late-stage hospital exposure with reimbursement pressure |
| Care labor shortage | Remote monitoring, AI workflow, home care, robotics | Labor-heavy nursing and assisted care models |
| Retirement income risk | Annuities, managed payout products, longevity-risk transfer | Generic accumulation products built for younger savers |
| Senior housing demand | Operators with occupancy, pricing power and staffing control | Leveraged facilities exposed to wages, insurance and refinancing |
| Public funding stress | Systems that reduce hospital days and care hours | Unfunded pensions and care models dependent on public budgets |
Senior housing proves demand is not profit. US senior housing occupancy reached 89.5% in Q1 2026, the 19th consecutive quarterly increase, but operators still have to beat labor costs, insurance, refinancing, regulation and affordability ceilings. Occupancy creates the setup; labor and refinancing decide the margin.
Europe’s €5.7 trillion silver economy shows the spending pool is real. The investable edge is narrower: ageing spend that cuts hospital days, care hours, income failure and late-life dependency.
Long-term care is the stress test. OECD public long-term care spending is projected to almost double to 2.8% of GDP by 2050, pushing capital toward care models that need fewer workers, fewer beds and less public funding per extra year of life. The next funding fight centres on eligibility rules, private insurance, home-care substitution, and automation.
The retirement model was built on a quiet assumption: the most expensive years of old age would stay short. The 426 million silver tsunami breaks that math.
The market can no longer treat longevity as a clean social victory or a broad consumer theme. Longer lives now move through balance sheets as pension duration, healthcare claims, care labor shortages and income risk.
The question is who owns the bill when longer life stops being a triumph and becomes a liability moving through pensions, insurers and markets.