Published on: 2026-04-02
Updated on: 2026-04-02
Dubai physical crude traded at $126–$140 per barrel, while Brent futures traded near $100–$113, creating a $37–$40 gap that barely existed before March 2026.
Futures are pricing a short-lived disruption, but the physical market signals a genuine supply crisis with roughly 8 million barrels per day temporarily offline.
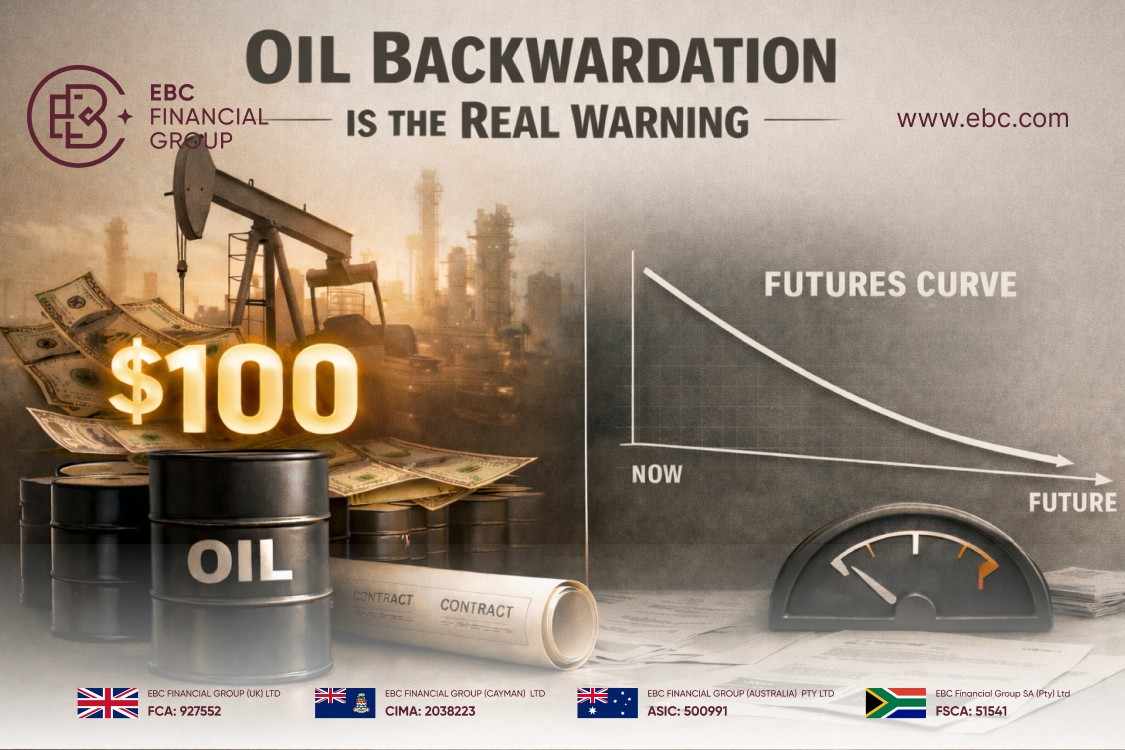
The oil curve has flipped into extreme backwardation, with front-month contracts at double-digit premiums over the next month.
If the Strait of Hormuz stays closed past mid-April, futures could reprice $20–$50 higher in weeks as paper catches up to physical reality.
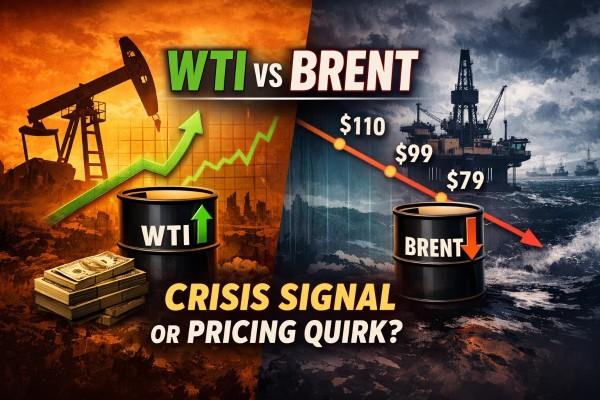
Two oil markets exist right now, and they are telling completely different stories. Brent and WTI futures show crude trading between $93 and $113 per barrel as of late March 2026.
But buyers paying for real, physical barrels of crude in Asia are spending $126–$140, a $37–$40 premium that did not exist before the conflict started.

This is not a pricing quirk. It is a structural fracture in the global oil market, and traders who focus only on futures are seeing only half the picture.
Paper oil refers to futures contracts traded on exchanges like NYMEX and ICE. Over 95% of these contracts never result in physical delivery. Billions of paper barrels change hands daily, dwarfing the roughly 40 million barrels of physical oil that move through the spot market.
Physical oil is crude loaded onto tankers, adjusted for quality and transportation costs, and delivered to a refinery. The delivered cost determines the price at the gas pump, the cost of jet fuel, and refiner margins.
In normal times, arbitrage keeps these two prices closely linked. But when supply gets disrupted at the scale we are seeing now, that mechanism breaks down.
| Benchmark | Pre-War (Feb 2026) | Current (Late March 2026) | Change |
|---|---|---|---|
| Brent Futures (Front Month) | ~$71–$76 | ~$100–$113 | +36–47% |
| WTI Futures (Front Month) | ~$67 | ~$93–$103 | +39–54% |
| Dubai Physical Crude | ~$71 | ~$126–$140 | +76–97% |
| Paper vs Physical Gap | $37–$40 | Historic |
Dubai physical crude has gained 76% since the conflict began, more than double the 36% rise in Brent futures. Asian refiners are competing for every available cargo while Western futures markets debate whether the crisis will last.
President Trump’s periodic suggestions that the conflict could end soon have repeatedly knocked futures prices lower. Traders call this jawboning, and it works on paper contracts because of futures price expectations. But jawboning does not put physical barrels on tankers.
The futures market is dominated by hedge funds, algorithmic traders, and institutional investors who trade on sentiment rather than physical supply needs.
Many are betting the disruption will be temporary. Brent for December 2026 delivery is priced around $80, a steep discount to the front month that shows how confident paper markets are about a quick resolution.
Brent futures represent crude loading in the North Sea, but the real crisis is in the Middle East and Asia. Shipping from the North Sea to Asia takes 37–48 days, while shipping from Fujairah to India takes under 3 days. Asian refiners cannot wait six weeks for alternative barrels when storage is running dry.
The Strait of Hormuz normally handles around 20 million barrels per day, roughly 20% of global petroleum liquids consumption.
Since the closure in early March 2026, energy agencies estimate roughly 8 million barrels per day of supply was temporarily taken offline. That is the largest monthly supply disruption on record.
The IEA responded by coordinating the release of 400 million barrels from strategic petroleum reserves, the biggest coordinated release in its history.
The U.S. Strategic Petroleum Reserve sits at around 345 million barrels after drawdowns in 2022–2023 that were never replenished. U.S. commercial crude stockpiles fell to 427.3 million barrels, the lowest since November 2022.
OPEC+ has confirmed no plans to increase output before Q3 2026. Saudi Arabia has maintained voluntary cuts of 1 million barrels per day since mid-2025.
Combined with Iranian export disruptions, total OPEC+ output sits roughly 3.5 million barrels per day below capacity, the widest gap since the 2020 pandemic cuts.
At the start of 2026, WTI was in mild contango with near-term contracts around $60 and later months slightly higher. Now, prompt WTI trades near $99, while late-2026 contracts sit in the mid-$70s.
The front-month premium over the second month has reached $14.20, a level analysts describe as extreme.
Backwardation makes storing oil unattractive because selling today pays more than holding for later delivery. This pushes inventory out of tanks and into the spot market.
For traders holding long futures, the structure creates positive roll yield when they sell an expensive expiring contract and buy a cheaper next-month contract.
The biggest winners are participants who can deliver actual physical barrels into a shortage. Airlines, grain merchants, and energy-intensive manufacturers can buy cheaper futures dated for late 2026, locking in prices below current physical rates.
Households and small businesses have no such option and bear the full impact through higher gasoline, diesel, and food costs.
Paper-physical disconnects of this magnitude do not last. Refineries must secure real barrels or shut down. When they bid up benchmarks to attract cargoes, futures follow.
Geopolitical strategist Marko Papic of BCA Research projects the world will hit an “oil cliff” by mid-April, when reserve releases and stopgap measures run out. JPMorgan warns that if the Strait stays closed, futures will reprice sharply higher.
Goldman Sachs estimates the conflict has already added $14–$18 per barrel in risk premium.
Any sudden ceasefire or diplomatic breakthrough could trigger a rapid price collapse. Technical analysts point to a liquidity gap between $90 and $95 that could accelerate a downward move. Position sizing matters more than conviction in this environment.
Three signals will tell you whether the gap closes upward or downward. Track physical benchmarks like Dubai crude alongside Brent and WTI, because the physical market leads during real supply stress. Monitor reserve drawdown rates and the mid-April timeline when stopgap supplies run thin.
Also watch the backwardation spread between the first- and second-month contracts. If it widens beyond $14, the shortage is intensifying, and paper is about to catch up. If it narrows, the market believes supply will normalize.
Paper oil refers to futures contracts on financial exchanges where most positions close before delivery. Physical oil is actual crude delivered to refineries. Both usually trade near the same price, but supply crises can break that link.
Futures price in expectations that the Hormuz disruption will be short-lived, and political de-escalation rhetoric has pushed paper prices down. Physical oil reflects the immediate reality that real barrels are scarce.
Dubai physical crude traded at $126–$140 per barrel while Brent futures sat around $100–$113 in late March 2026. That $37–$40 gap is up from less than $1 before the conflict started.
The gap closes in one of two ways: physical supply improves, and prices drop, or futures reprice sharply higher to reflect physical reality. Analysts warn a $20–$50 upward snap is possible if the disruption persists.
Backwardation means near-term contracts trade at a premium to later months, benefiting long positions through positive roll yield. It signals that the market expects current tightness to ease over time and discourages oil storage.
The $40 gap between paper and physical oil shows the market two competing realities. Futures say this conflict will end soon. Physical barrels say the world is running out of options right now.
Watching Brent or WTI alone gives you an incomplete picture. Physical benchmarks, inventory drawdown rates, backwardation spreads, and the mid-April reserve cliff will determine where oil goes next. Traders who track all of these will be positioned ahead of the snap, whichever direction it goes.
Disclaimer: This material is for general information purposes only and is not intended as (and should not be considered to be) financial, investment or other advice on which reliance should be placed. No opinion given in the material constitutes a recommendation by EBC or the author that any particular investment, security, transaction or investment strategy is suitable for any specific person.