Published on: 2026-05-29
Heiken Ashi is a charting technique used to smooth price action and more clearly identify market trends. It modifies how traditional candlesticks are calculated, using average price data rather than plotting each candle from the exact open, high, low, and close.
Traders use Heiken Ashi because markets often look noisy on standard candlestick charts. Rapid colour changes, long wicks, and erratic candles can make trends harder to read. Heiken Ashi simplifies the view, helping traders focus on trend direction, momentum, and possible reversal points without reacting to every minor price movement.
Heiken Ashi is a Japanese charting method that smooths price movement for a more readable display. The term roughly translates to “average bar” in Japanese, which reflects how the candles are built.
Unlike traditional candlestick charts, Heiken Ashi candles do not show the exact open and close price for each period. Instead, they use a modified formula based on averages. This changes the chart's appearance and makes trends look cleaner.
Heiken Ashi candles are made by averaging price data. Rather than just using the exact open, high, low, and close for each period, this method mixes those values with data from the previous candle.
This creates smoother candle formations. A trend that may look messy on a standard candlestick chart can appear more organised on a Heiken Ashi chart.
Heiken Ashi helps reduce market noise. Market noise refers to small price moves that don’t really affect the broader trend. These can distract traders, especially new ones. On a regular chart, you might see lots of red and green candles during a small pullback, even if the main trend is still strong. Heiken Ashi usually smooths these out, making the chart look more consistent.
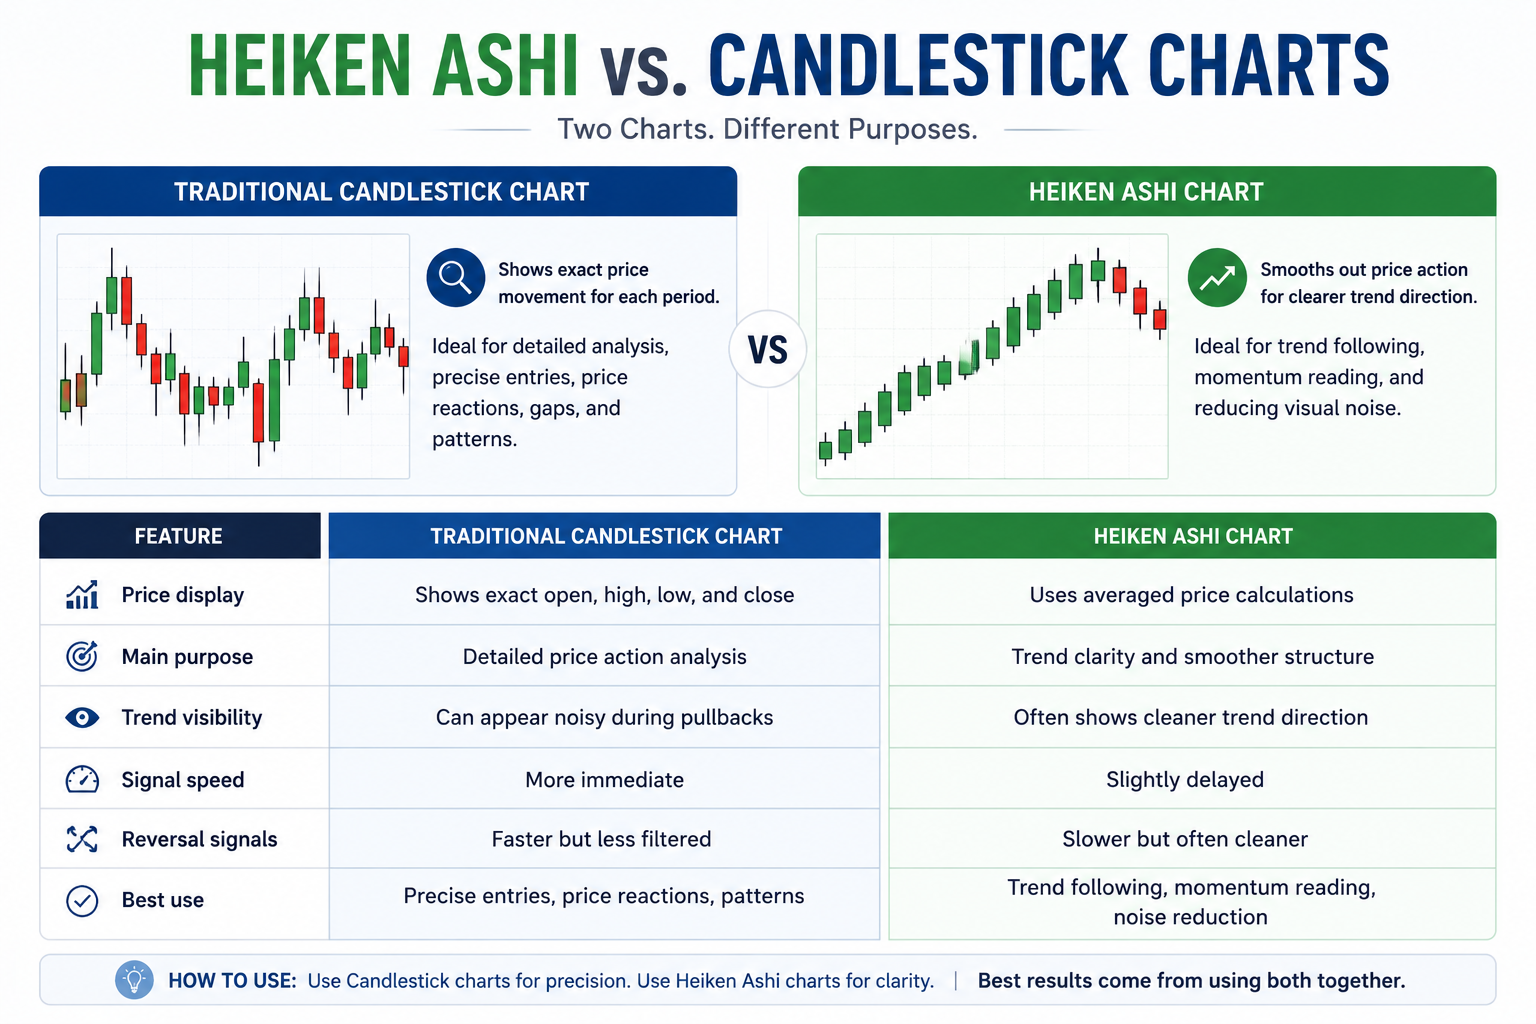
Both traditional candlestick charts and Heiken Ashi charts use candle shapes, but they’re meant for different things.
Traditional candlesticks show the exact price movement for each period. They’re helpful when traders want precise details about entry points, closing prices, gaps, or how prices moved within the day.
Heiken Ashi smooths out price action, making it easier to spot trend direction and reduce visual noise. The downside is that it reacts more slowly since the candles are based on averages.
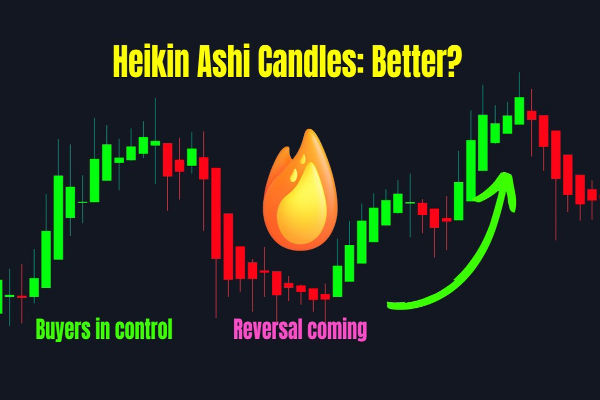
Bullish candles are usually green or white, depending on the chart you use. They show that buyers are in control.
A row of bullish Heiken Ashi candles often means the market is trending up. If the candles are big and steady, it usually shows strong momentum.
Bearish candles are usually red or black. They show that sellers control the price.
A series of bearish candles points to a downtrend. The steadier the candle bodies are, the stronger the selling pressure seems.
Bullish candles with small or no lower wicks often show strong upward momentum. This means sellers didn’t make much progress during that time.
Trend traders often see this as a sign that the trend will keep going. It means the upward move is still strong, especially if the candles are above a key moving average or support area.
Bearish candles with small or no upper wicks show strong downward pressure. Buyers aren’t able to push the price up much.
This can be a sign that the downtrend will continue, especially if the market is already moving lower.
A clear Heiken Ashi trend usually has many candles of the same colour in a row. The fewer candles of the opposite colour, the stronger the trend looks.
For example, if the market is rising and you see several green candles with small lower wicks, it shows a steady uptrend. Traders often stick with the trend until the candles get smaller, wicks show up on both sides, or the colour changes.
Possible reversals often appear when the candle bodies get smaller, and wicks appear on both the top and the bottom. This signals indecision in the market.
A change in candle colour can also hint at a possible reversal, but it’s not a sure thing. Traders usually check support and resistance, volume, moving averages, or regular candlestick patterns before making a move.
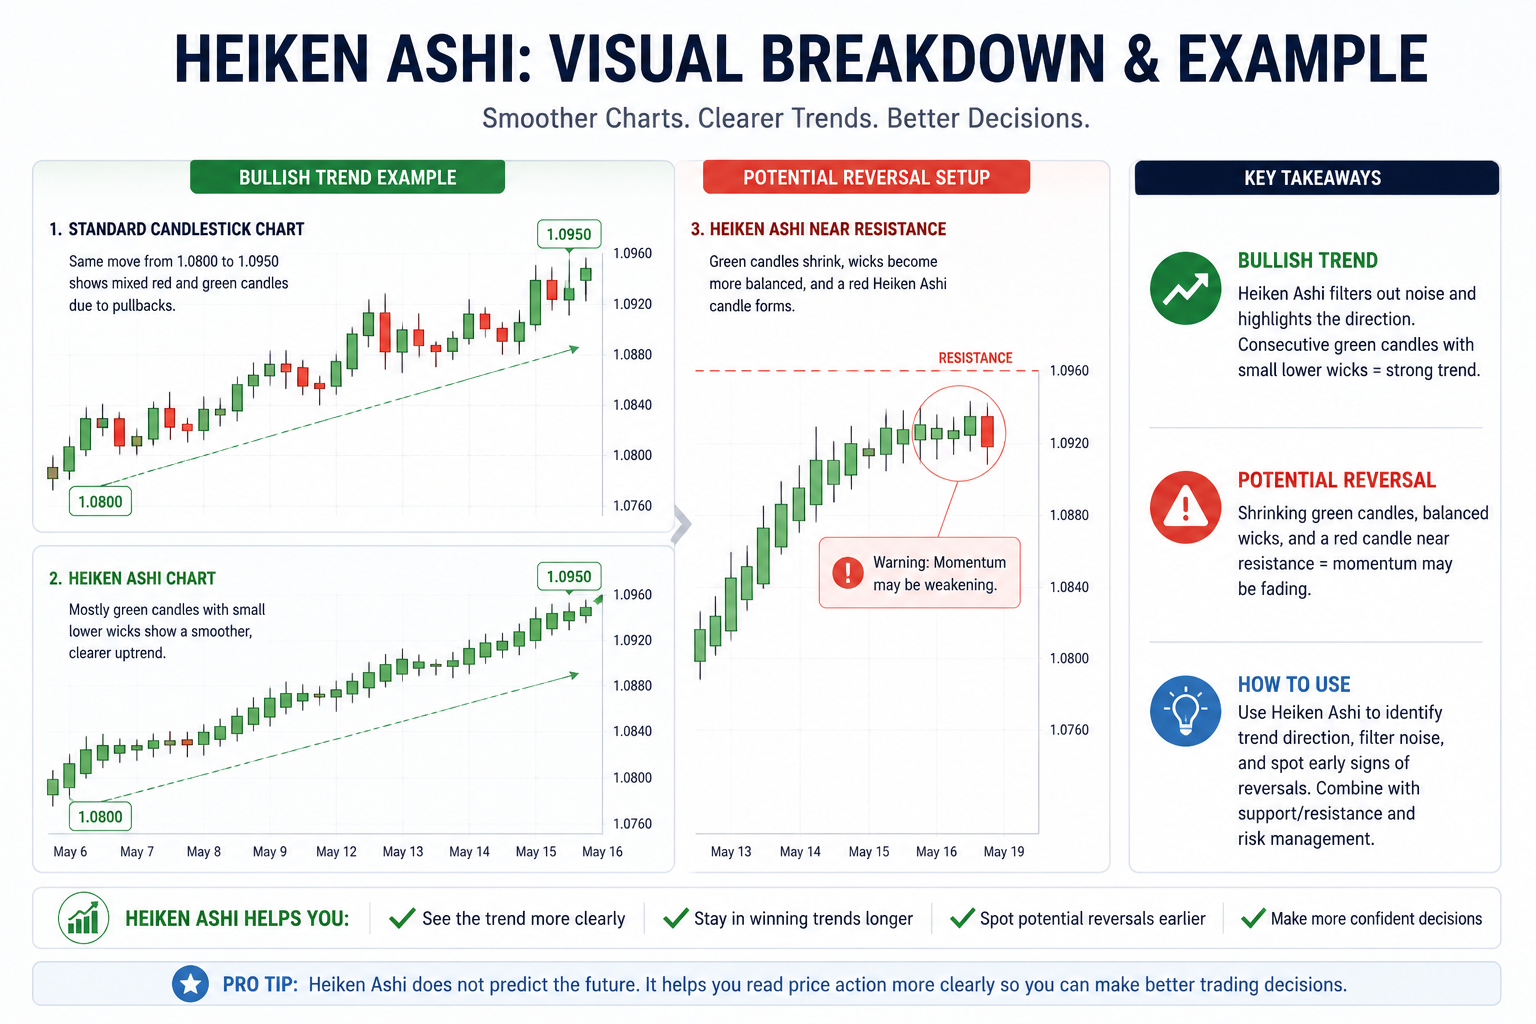
A bullish Heiken Ashi trend might show several green candles moving up in a row. On a regular candlestick chart, the same move could produce both red and green candles due to small pullbacks. The Heiken Ashi chart smooths out the chart, making the overall uptrend easier to spot.
For example, imagine a currency pair rising from 1.0800 to 1.0950 over several sessions. A standard candlestick chart may show several red candles along the way. A Heiken Ashi chart may show mostly green candles with small lower wicks, helping traders recognise that the underlying trend remains bullish.
A possible reversal might show up when the green candles get smaller, the wicks on top and bottom become more even, and a red Heiken Ashi candle forms near resistance. This doesn’t guarantee a reversal, but it’s a warning that bullish momentum is fading.
A simple trend-following method looks for a series of the same-coloured Heiken Ashi candles. Traders may stay long during a sequence of bullish candles and stay short during a sequence of bearish candles.
The signal is stronger when the candles have full bodies and only small wicks on the opposite side.
In an uptrend, traders may wait for a short pullback before looking for bullish Heiken Ashi candles to return. In a downtrend, they may wait for a bounce before bearish candles resume.
This helps traders avoid chasing prices after a large move.
Many traders use Heiken Ashi together with a moving average. For example, if bullish Heiken Ashi candles are above a rising 50-period moving average, it can support a long position.
Bearish candles below a falling moving average can support a short position.
Heiken Ashi signals become more useful when they appear near key levels. A bullish candle near support may suggest buyers are defending the area. A bearish candlestick near resistance may signal that sellers are stepping in.
This approach gives more context and helps reduce the risk of acting on weak signals.
Candlestick Chart: A candlestick chart shows price movement using candles that represent the open, high, low, and close of each period.
Trend Following: A trading approach that aims to capture price moves in the direction of the prevailing market trend.
Technical Analysis: Technical analysis studies price charts, patterns, indicators, and market behaviour to evaluate potential trading opportunities.
Moving Average: A moving average smooths price data over a selected number of periods, helping traders identify trend direction and dynamic support or resistance.
Market Noise: Market noise refers to short-term price fluctuations that can distract traders from the broader trend or main market structure.
Yes, Heiken Ashi can be helpful for beginners because it makes trends easier to spot. It reduces visual noise and helps traders avoid reacting to every small candle. Still, beginners should confirm signals with support and resistance, and use good risk management.
Heiken Ashi isn’t better in every situation. It’s better for seeing trends clearly, while regular candlesticks are better for exact price details. Many traders use Heiken Ashi for directional guidance and standard candlesticks for precise trades.
Heiken Ashi does not predict reversals with certainty. It can highlight weakening momentum through smaller candles, wick changes, and colour shifts. These signs are useful, but they should be confirmed with market structure or another technical tool.
Heiken Ashi works on many timeframes, but it’s usually more reliable on higher ones, such as 1-hour, 4-hour, or daily charts. Very short timeframes can still have noise and false signals.
Heiken Ashi gives traders a clearer way to read price action. Averaging the candle data smooths out market moves and makes trends easier to spot. This helps traders focus on direction, momentum, and trend continuation instead of reacting to every small change.
Heiken Ashi’s main strength is clarity, but its weakness is delay. It works best when traders know both sides: it can simplify trend analysis, but it shouldn’t replace detailed price charts, market structure, or risk management.