Published on: 2026-03-25
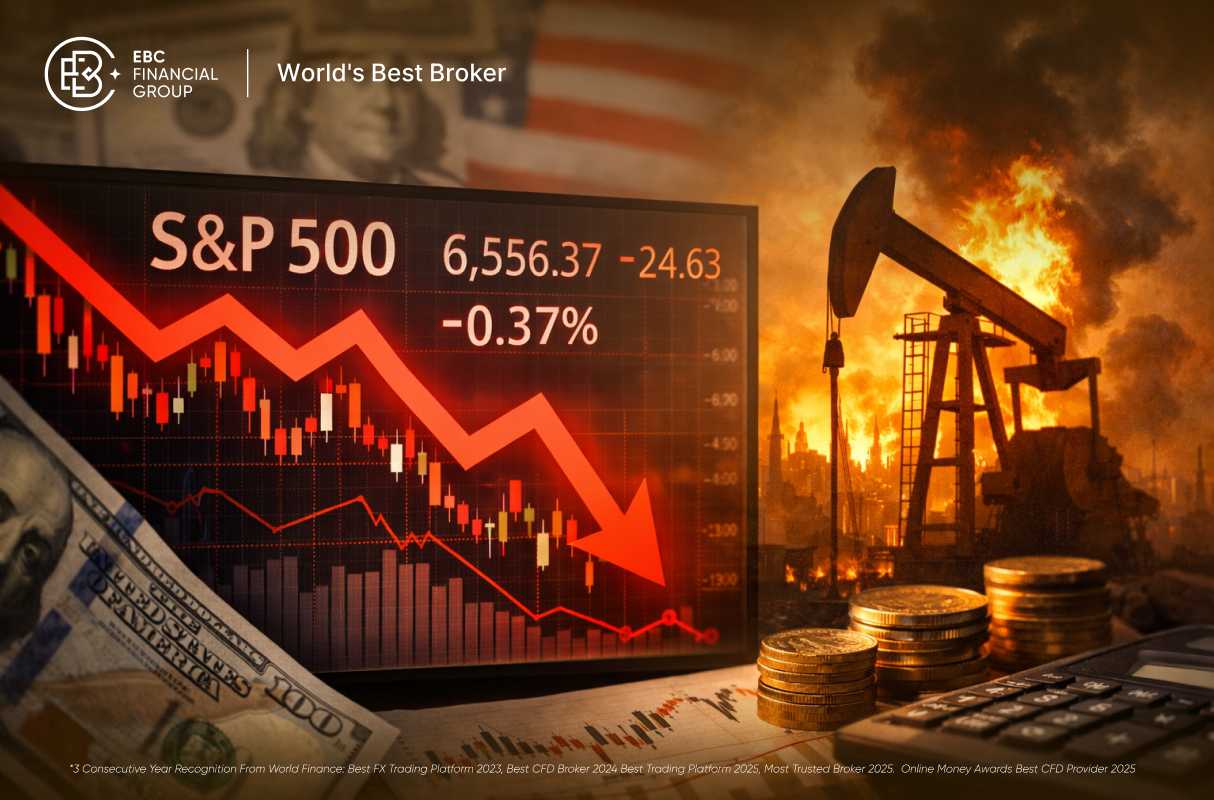
Stagflation concerns have returned to the S&P 500 after the index closed at 6,556.37 on March 24. Investors are now questioning whether the recent selloff is a typical correction or the beginning of a more significant, macro-driven decline.
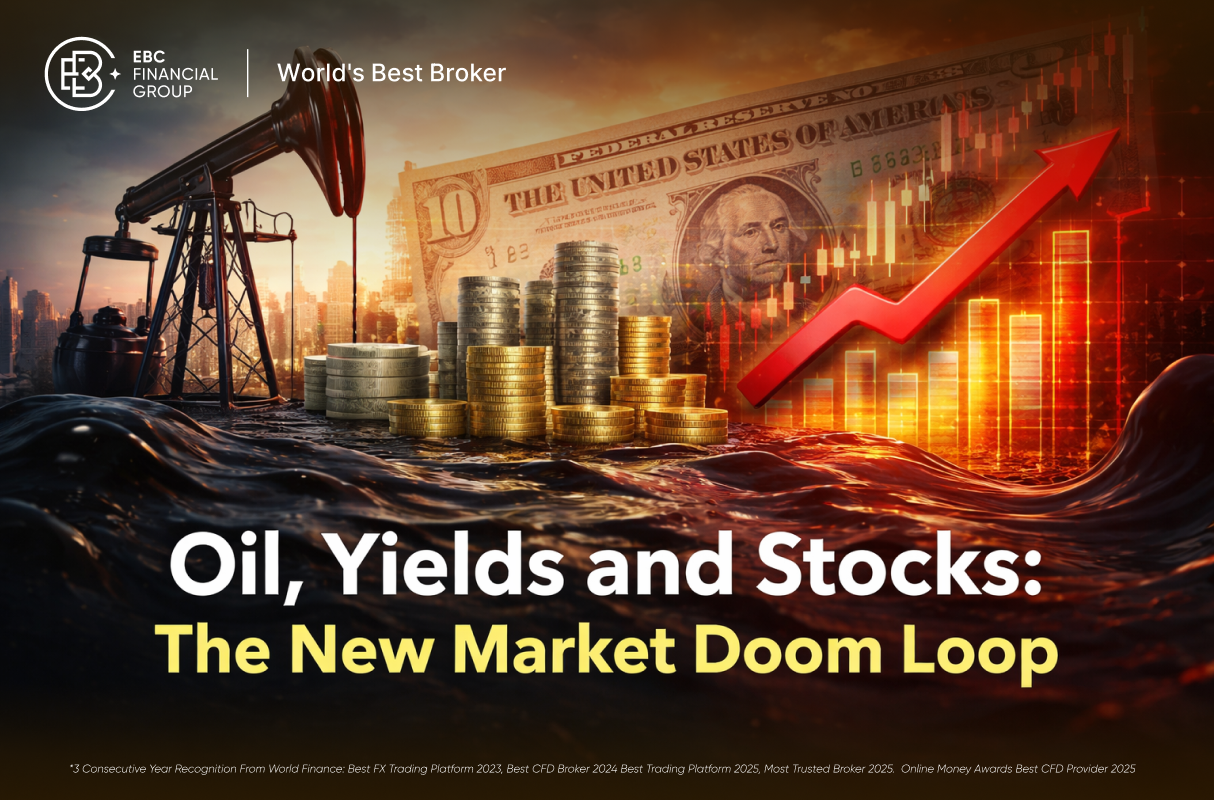
The market is trading below its 200-day moving average for the first time since May 2025. Oil prices and Treasury yields have become the primary drivers for risk assets.

The market faces pressure from elevated energy prices, weaker economic data, and a Federal Reserve constrained by persistent inflation. While this does not guarantee a bear market, it suggests the current pullback is more macro-driven than routine.
The S&P 500 has entered a bearish trend, primarily due to increasing stagflation concerns.
A surge in oil prices, driven by conflict in the Middle East, is the main catalyst for current market stress.
The Federal Reserve’s hawkish stance is offering investors limited relief.
Energy stocks are among the few outperformers, while technology and consumer discretionary sectors face significant pressure.
The immediate catalyst is the Middle East energy shock. The IEA says crude and product flows through the Strait of Hormuz have plunged from around 20 million barrels a day before the war to a trickle, with Gulf producers cutting output by at least 10 million barrels a day.
As a result, oil has shifted from a geopolitical issue to the market’s central macroeconomic factor.
Brent crude briefly exceeded $119 on March 19 and settled at $104.49 on March 24 after a 4.6% rebound. U.S. crude closed at $92.35.
These elevated prices continue to pose inflation risks, even after the initial spike subsided.
The stagflation concern is not coming solely from oil. S&P Global’s preliminary March survey showed the U.S. composite PMI fell to 51.4, an 11-month low, while input prices increased at the fastest rate in 10 months.
This combination signals slower demand and rising costs, a classic warning sign for equities.
The labor market has softened but remains stable. February nonfarm payrolls declined by 92,000, while the unemployment rate stayed at 4.4%. Part of the payroll decrease was due to healthcare strike activity.
That is why “softening labour market” is more accurate than recession-level wording, at least for now.

| Market indicator | Latest reading | Why it matters |
|---|---|---|
| S&P 500 | 6,556.37 | Latest March 24 close |
| Brent crude | $104.49 | Inflation shock remains active |
| 10-year Treasury yield | 4.39% | Higher discount rates pressure equities |
| U.S. composite PMI | 51.4 | Business activity slowed in March |
| February payrolls | -92,000 | Hiring backdrop has weakened |
The latest jobs report showed a loss of 92,000 U.S. jobs in February, and last quarter’s GDP growth was revised down to 0.7%.
Before the Iran conflict, the U.S. economy was already showing signs of stagflation. The closure of the Strait of Hormuz has significantly intensified these conditions.
The impact of this supply disruption now extends beyond crude prices, spreading through the broader economy and significantly increasing stagflation risk.
Shortages of specialised gases from the Gulf are causing an immediate crisis for semiconductor and advanced electronics production.
Fertiliser shortages are also raising concerns about crop yields in South Asia.
These pressures are contributing directly to goods inflation, which had only started to ease before the conflict.
The Fed maintained rates at 3.50% to 3.75% on March 18. Powell stated the U.S. economy continues to expand at a solid pace, while the implications of Middle East developments remain uncertain.
This reflects a cautious approach rather than a dovish signal.
A key issue is the disconnect between the Fed and the market. The Fed’s median projection still indicates one quarter-point cut in 2026, but traders have largely abandoned expectations for easing this year and are now considering the possibility of a rate hike if inflation worsens.
This mismatch is one reason the S&P 500 has struggled to find support.
Goldman Sachs regime models indicate the equity market now prices a 35% probability of recession, up from 10% two weeks ago, while the implied likelihood of stagflation is only 8%.
This suggests the market is anticipating a sharp downturn in growth rather than a gradual stagflationary period.
Another analyst argued that markets' price action is "more indicative of trading for a recessionary outcome" rather than a stagflation scenario.
If the market is trading for a recession, duration and Treasuries are the preferred hedges. If stagflation prevails, energy and real assets are favored. The market cannot fully price both scenarios simultaneously.
Current market conditions have produced clear groups of outperformers and underperformers across S&P 500 sectors.
ExxonMobil shares reached an all-time high as its upstream portfolio benefited from the oil price surge. Chevron has also performed strongly.
GE Vernova has emerged as an unexpected beneficiary, with its natural gas turbines and nuclear power services sold out through 2028 on the back of surging AI data centre power demand.
Nike and Starbucks both reported weaker domestic sales as higher national gas prices strain household budgets.
NVIDIA, CrowdStrike, and Western Digital are under pressure as high-valuation tech stocks decline in a risk-off environment. The Invesco QQQ Trust fell over 1% on the day.
The Russell 2000 is the worst performer among major indexes, down over 8% year to date, as small caps face a double whammy from energy cost pressures and tighter financial conditions.
| Indicator | Latest reading | Interpretation |
|---|---|---|
| Trend | Lower highs since the January peak | The broader daily structure remains weak |
| 200-day moving average | 6,619.11 | The index is trading below a key long-term trend line |
| Short-term resistance | Near the 10-day moving average | Recent rallies have repeatedly stalled there |
| First support zone | Around 6,500 to 6,600 | This area has become the market’s first key test |
| Deeper support | Around 6,400 to 6,500 | A break lower would point to broader technical damage |
The technical outlook is bearish but not yet severe. Analysts reported the index below its 200-day average, with recent trading repeatedly failing at short-term resistance.
Other strategists have identified the 6,400-6,500 area as the next zone where the market might stabilise.
Oil prices are rising because the war in the Middle East has severely disrupted flows through the Strait of Hormuz, a key global oil chokepoint. This has tightened supply and pushed crude above $100 a barrel.
Not officially. The index is below its 200-day moving average and about 5% below its January peak, indicating a weaker trend, but it remains well above the 20% decline that defines a bear market.
Energy, utilities, and consumer staples typically outperform growth-oriented sectors when inflation is high and growth slows. This pattern is evident in the current market rotation.
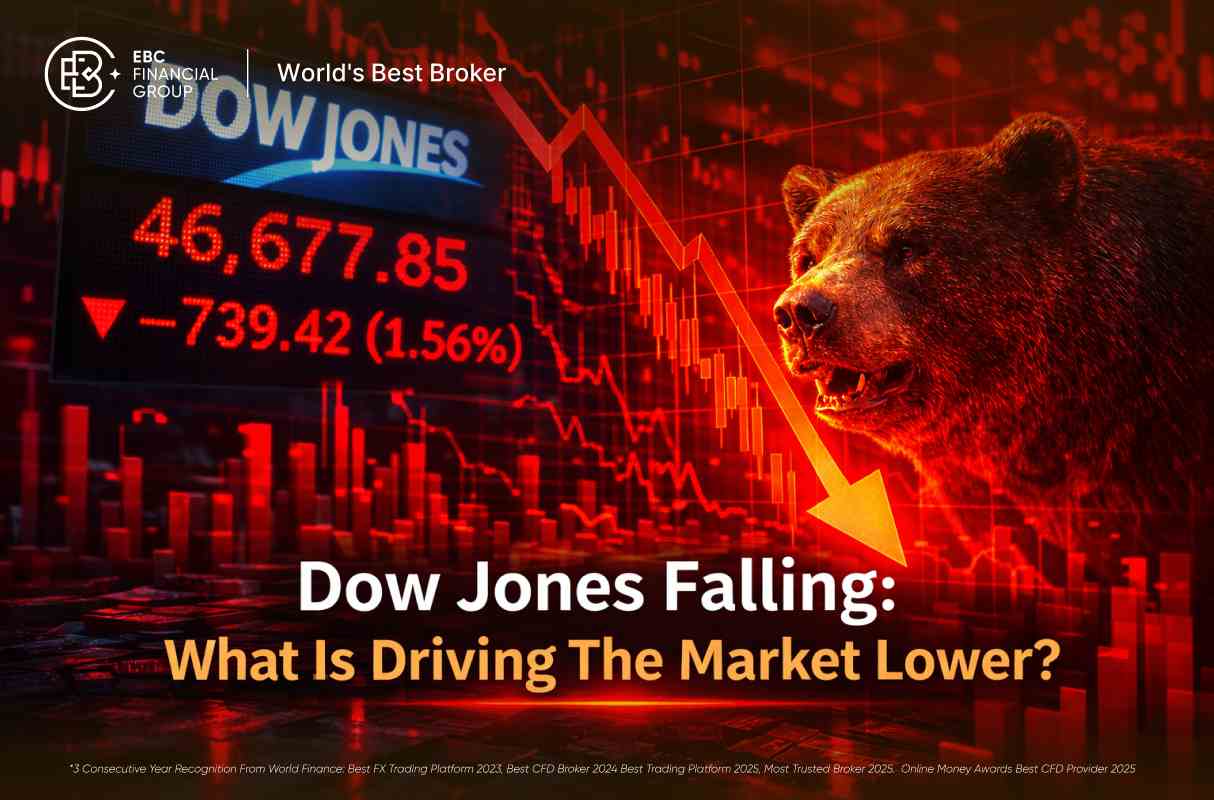
The S&P 500 selloff has worsened, moving beyond profit-taking into a more fragile macroeconomic phase. Oil prices remain high, yields are rising, the Fed has limited room to ease, and the index has broken a key long-term technical level.
A full bear market is not inevitable. However, until oil stabilizes, yields stop rising, and growth data improves, stagflation is likely to remain the primary risk for the S&P 500.
Disclaimer: This material is for general information purposes only and is not intended as (and should not be considered to be) financial, investment or other advice on which reliance should be placed. No opinion given in the material constitutes a recommendation by EBC or the author that any particular investment, security, transaction or investment strategy is suitable for any specific person.