Published on: 2026-04-24
Updated on: 2026-04-24
Media coverage of the International Monetary Fund’s (IMF) April outlook has primarily emphasised a single figure: 3.1% projected global growth in 2026.
While this figure is significant, the implications for equity markets are better understood by examining the range of downside scenarios rather than the base forecast alone.
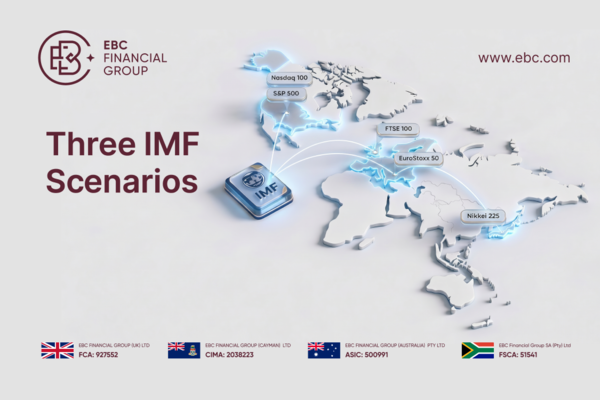
The IMF’s latest World Economic Outlook (WEO) lays out a reference case in which the Middle East conflict remains limited, global growth slows to 3.1% in 2026 and 3.2% in 2027, and inflation rises modestly before easing again. Reuters reported that the IMF’s adverse scenario projects 2026 growth at 2.5%, while a deeper conflict could push the global economy into recession.
For equity indices, these scenarios represent distinct market regimes rather than mere variations of slowing growth. One scenario evaluates the capacity of equities to withstand a temporary energy shock. Another examines the effects of elevated oil prices, persistent inflation, and tighter financial conditions on regional and sectoral market divergence. The most severe scenario assesses which indices remain resilient when weak growth coincides with high inflation.
Consequently, the IMF’s scenarios serve more effectively as a framework for market analysis than as a simple headline forecast.
The following comparisons are based on sector composition and historical correlations under hypothetical scenarios. They do not constitute a recommendation to trade any specific index or CFD product.

The reference case represents the least adverse scenario, though it does not constitute a straightforward risk-on environment. Growth is subdued, energy prices are elevated, and inflation exceeds initial market expectations for the year. Under these conditions, indices with broader United States (US) exposure are comparatively better positioned than those sensitive to imports, while indices with significant energy, financial, and defensive sector representation have a sector composition that may respond differently to energy-driven shocks.
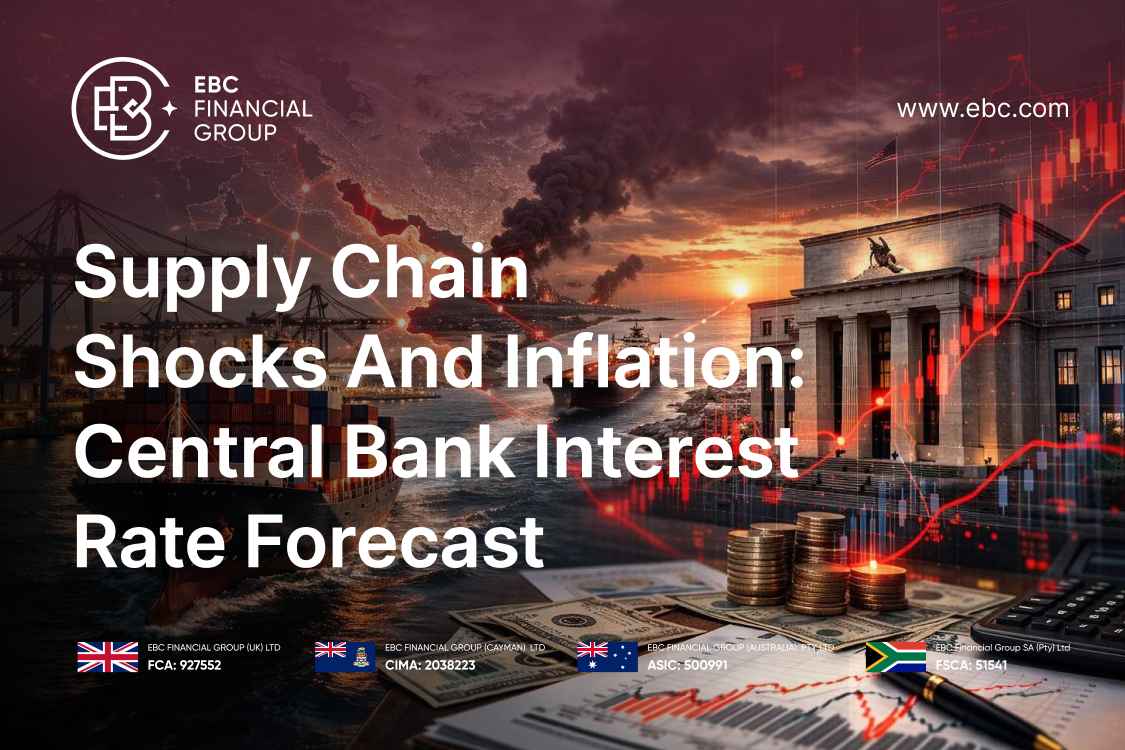
In the adverse scenario, market divergences become more pronounced. Elevated energy prices and unstable inflation expectations complicate the interest rate outlook, increasing pressure on growth-oriented benchmarks, particularly those valued on long-term earnings projections. Energy-importing regions are especially vulnerable, as higher fuel costs contribute to inflation, compress profit margins, and dampen domestic demand.
The severe scenario does not resemble a typical recession risk; rather, it functions as a stagflation stress test. Reuters reported that the IMF’s severe scenario projects oil prices averaging US$110 in 2026 and US$125 in 2027. The IMF’s Global Financial Stability Report (GFSR) has also indicated that the ongoing conflict has already depressed global equities and increased sovereign bond yields. This combination challenges the conventional expectation that slower growth will necessarily result in lower yields and provide relief for long-duration equities.
Interpreting the IMF scenarios through the lens of index composition provides the most actionable insights.
Nasdaq 100
The Nasdaq 100 represents the most prominent pressure point under adverse or severe IMF scenarios. Its concentration in high-growth sectors and exclusion of financial companies enhances performance when liquidity is abundant and future earnings are favoured. However, this structure increases vulnerability when inflation and yields remain elevated. The GFSR identifies artificial intelligence (AI) as a potential amplification channel, and Reuters reported that the IMF cautioned that a prolonged conflict could substantially slow AI investment and negatively impact firms within the AI value chain.
S&P 500
The S&P 500 occupies an intermediate position. According to S&P Dow Jones Indices, it serves as the leading benchmark for large-cap US equities, encompassing approximately 80% of US market capitalisation. This breadth provides greater capacity to absorb shocks compared to the Nasdaq 100, although the index remains susceptible to valuation pressures, earnings downgrades, and rising yields.
Euro Stoxx 50
Within this framework, the Euro Stoxx 50 serves as the primary benchmark for continental Europe. Its vulnerability arises not only from sector composition but also from a combination of exposure to imported energy, subdued regional growth, and limited direct insulation against oil shocks. State Street characterises the Euro Stoxx 50 as representing leading companies across 20 Euro Stoxx supersectors, offering broad eurozone blue-chip exposure rather than a concentrated energy hedge.
FTSE 100
The FTSE 100 provides a notable contrast. Although it is not immune to global equity downturns, its sector composition distinguishes it from technology-focused or import-sensitive indices. According to FTSE Russell’s factsheet, the FTSE 100 has significant exposure to sectors such as Oil, Gas and Coal, Health Care, Banks, and other traditional industries. In the event of an energy-driven shock, this composition offers the FTSE 100 greater relative resilience than the Nasdaq 100 or the Euro Stoxx 50.
Nikkei 225
The Nikkei 225 is characterised by dual exposures. As of 20 April, Nikkei’s daily summary indicates that Technology accounts for 53.05% of the index, making it sensitive to valuation and AI-related pressures, similar to other growth-oriented benchmarks. Concurrently, Asia faces heightened vulnerability to rising energy import costs. The IMF reports that the region’s oil and gas consumption representsapproximately 4% of gross domestic product (GDP), with net oil and gas imports accounting for about 2.5% of economic output.
The scenario analysis above illustrates how different index compositions may respond to macroeconomic shocks. This information is provided for educational context only and does not indicate how any specific CFD product will perform.
Under the reference scenario, indices with broad US exposure or significant representation in energy, financial, and defensive sectors are likely to exhibit greater resilience. This dynamic maintains the relevance of the S&P 500 and FTSE 100 as contrasts to more growth-oriented or energy-import-sensitive benchmarks. The Nasdaq 100 may recover if market sentiment improves, but it remains vulnerable to persistent high yields. The Euro Stoxx 50 and Nikkei 225 face increased risk due to their sensitivity to energy imports.
In the adverse case, the Nasdaq 100 and Nikkei 225 are more exposed to valuation and energy-import pressures in these scenarios. Both are tied to technology and long-term earnings expectations. The Nikkei also has the regional energy-import overlay. The Euro Stoxx 50 remains exposed through Europe’s energy and industrial channels. The FTSE 100 does not become a winner, but it has a clearer relative defence because energy, banks, and cash-generative sectors tend to matter more when inflation and rates stay firm.
In the severe case, the market stops looking for obvious winners. It looks for the least vulnerable structures. The Nasdaq 100 faces the cleanest valuation test. The Nikkei 225 faces both valuation and energy-import pressure. The Euro Stoxx 50 remains caught between weaker growth and imported energy stress. The S&P 500 is broader, but not insulated. The FTSE 100’s sector mix gives it a structurally different profile from the other four, though a broad selloff would still pull it lower.
The essential insight is that the IMF scenarios do not predict which index will appreciate; rather, they clarify the specific risks associated with each index.
Because the IMF’s scenarios are modelling exercises, the labels matter less than the triggers. Markets will not wait for the IMF to declare that the world has moved from reference to adverse. They will infer it from oil, inflation expectations, yields, the dollar, and market breadth.
Oil is the first marker. If energy prices settle, the reference case stays credible. If energy prices remain elevated or physical disruption worsens, markets will have to price in a longer shock.
Inflation expectations are the second marker. A temporary energy spike is manageable if it does not change wider pricing behaviour. Once inflation expectations drift, central banks have less room to look through the shock.
Yields represent the third indicator. A decline in yields following the shock's dissipation provides relief for equities. Conversely, if yields rise while growth expectations deteriorate, markets are likely to price in stagflation rather than a conventional slowdown.
The US dollar serves as the fourth indicator. An appreciating dollar tightens global financial conditions, particularly for emerging markets and commodity importers. The GFSR notes that emerging-market assets have already experienced significant impacts, especially in more vulnerable commodity-importing nations.
Market breadth constitutes the fifth indicator. If market weakness is confined to overvalued growth sectors, investors may interpret the shock as selective. However, simultaneous declines in equities and bonds across regions make the severe scenario increasingly plausible. The GFSR observes that supply shocks have heightened the risk of more pronounced tightening in global financial conditions and introduced multiple amplification channels that could escalate market turmoil into broader financial instability.
For Contract for Difference (CFD) traders, this framework is directly relevant, as these indices are not merely theoretical benchmarks. EBC Financial Group includes CFDs on the US Nasdaq 100 Index (NASUSD), US S&P 500 Index (SPXUSD), Euro Stoxx 50 Index (E50EUR), UK FTSE 100 Index (100GBP), and Japan Nikkei 225 Index (225JPY).
These scenarios do not constitute trading recommendations; rather, they provide a comparative framework for assessing how various index CFDs may respond to identical macroeconomic shocks. NASUSD offers a focused perspective on growth, AI, and valuation pressures. SPXUSD provides a broader view of the US market. E50EUR captures eurozone blue-chip exposure. 100 GBP presents a more commodity- and traditional-industry-oriented European contrast. 225JPY integrates Japanese, technological, and Asian energy-import sensitivities.
The IMF’s recent outlook extends beyond a simple downward revision of growth forecasts, presenting markets with three distinct scenarios for 2026.
The reference scenario maintains the possibility of equity market stability, though the conditions are stringent. Oil prices must stabilise, inflation expectations must remain anchored, yields should not rise significantly, and the US dollar must not introduce additional global shocks.
In the adverse scenario, index composition becomes increasingly important. Growth-oriented benchmarks face heightened valuation pressures, while markets sensitive to energy imports have less margin for error. Indices with broader exposure and strong cash generation offer superior relative resilience.
The severe scenario renders traditional investment strategies less effective. Weak growth would not necessarily benefit long-duration equities if inflation and yields remain elevated. In this environment, the critical consideration is which index possesses the most robust combination of sectors, regions, and valuation risk.
This nuance is absent from the 3.1% headline figure. While the IMF’s base case establishes a central reference point, the true challenge for each equity benchmark lies in its structural resilience when oil prices, yields, inflation expectations, and the dollar are no longer favourable.