Published on: 2026-09-01
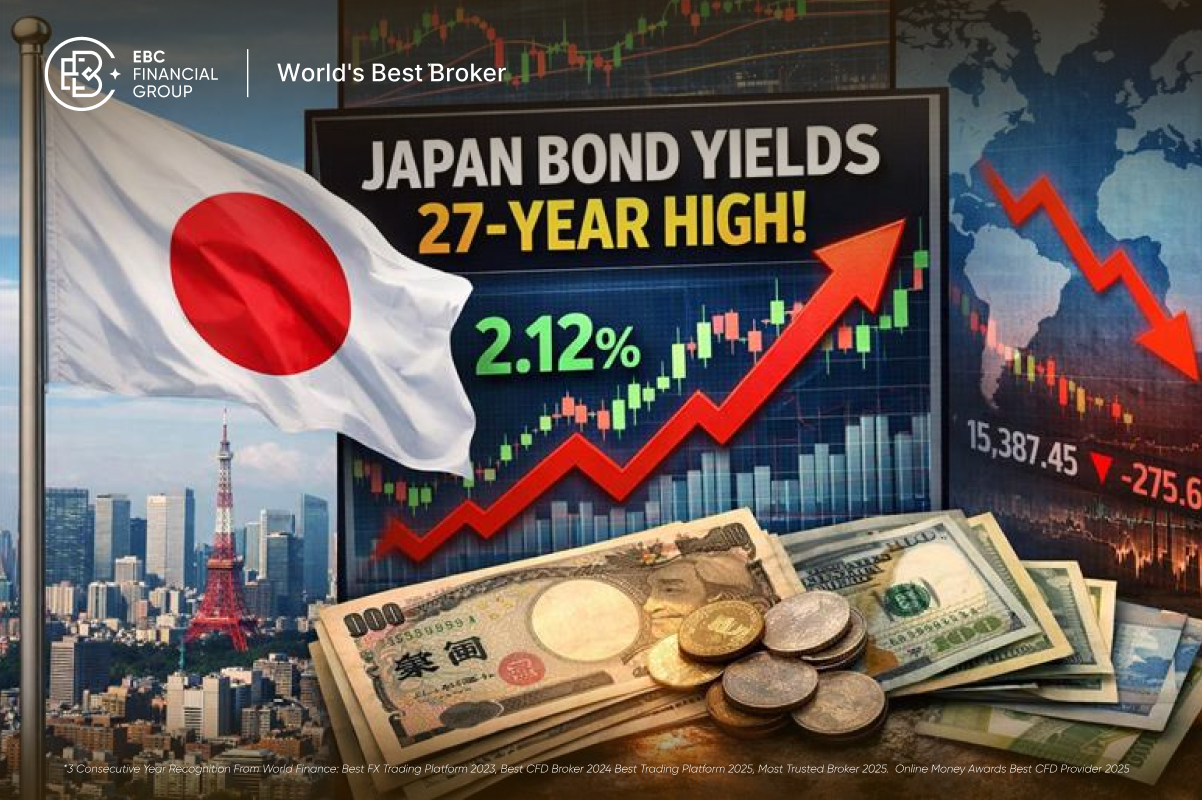
Japan's 10-year government bond yield rose to 2.955% on Tuesday, its highest since September 1996, leaving the benchmark less than five basis points from 3%. The selloff has run the length of the Japanese curve.

The move follows a hardening of Bank of Japan tightening expectations ahead of the 18 September policy decision. Domestic data have stayed firm enough to keep a hike in play. Long-dated yields are repricing an inflation backdrop Japan has not confronted in three decades.
Whether 3% becomes a ceiling or a floor is the live question. A ¥2.6 trillion 10-year auction on Tuesday offers the first read on appetite at these levels.
The 10-year JGB yield hit 2.95%, its highest since September 1996 and 132 basis points above a year ago.
Markets price roughly an 87% chance of a hike to 1.25% on 18 September, against 23% before the July meeting.
The 30-year yield holds above 4% and has outpaced the benchmark this month, pointing to term premium rather than rate expectations.
Fiscal 2027 budget requests near ¥140 trillion, with debt-servicing costs projected at a record ¥36.64 trillion.
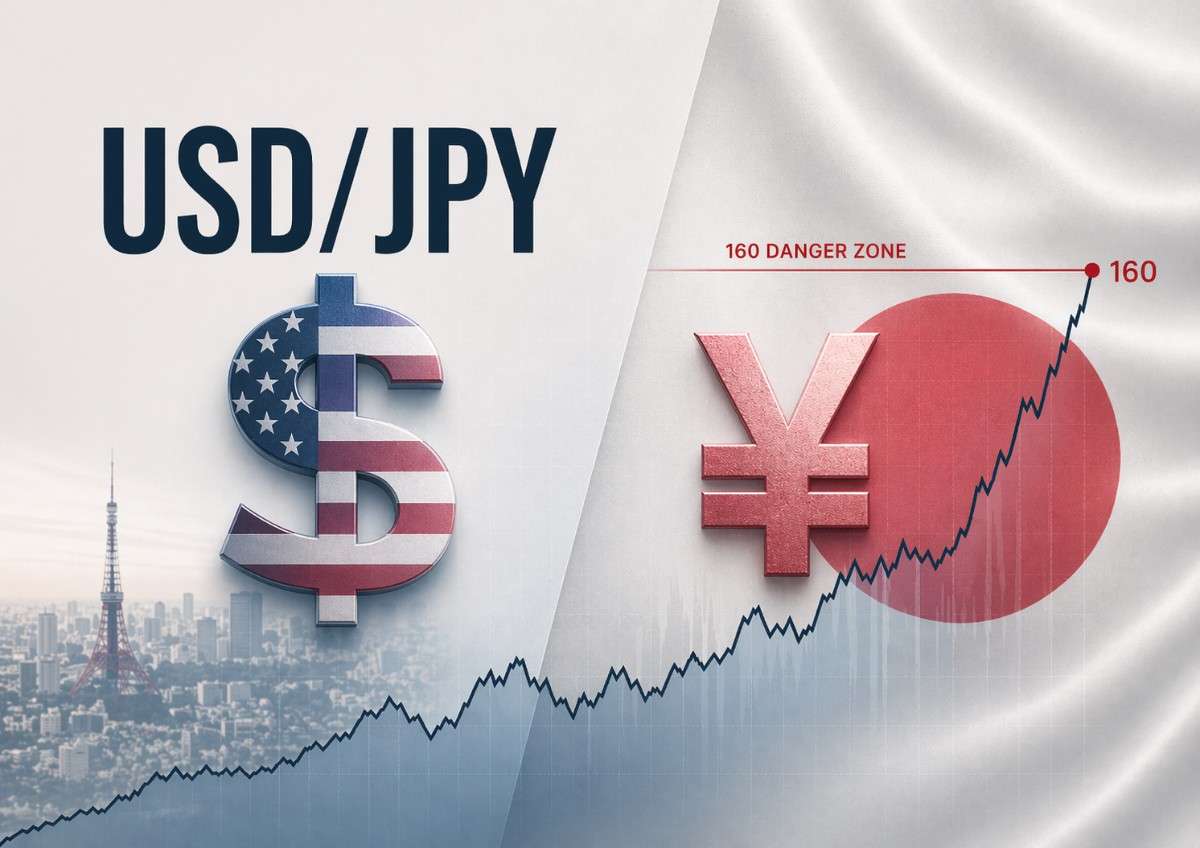
USD/JPY near 159.7 still favours the dollar on a 175 basis point spread against ten-year Treasuries.
The 10-year yield settled at 2.947%, roughly two basis points firmer on the session and 132 basis points above where it traded a year ago. The last time the benchmark held this ground, the BOJ’s official discount rate was 0.5% and the central bank owned a small fraction of outstanding government debt.
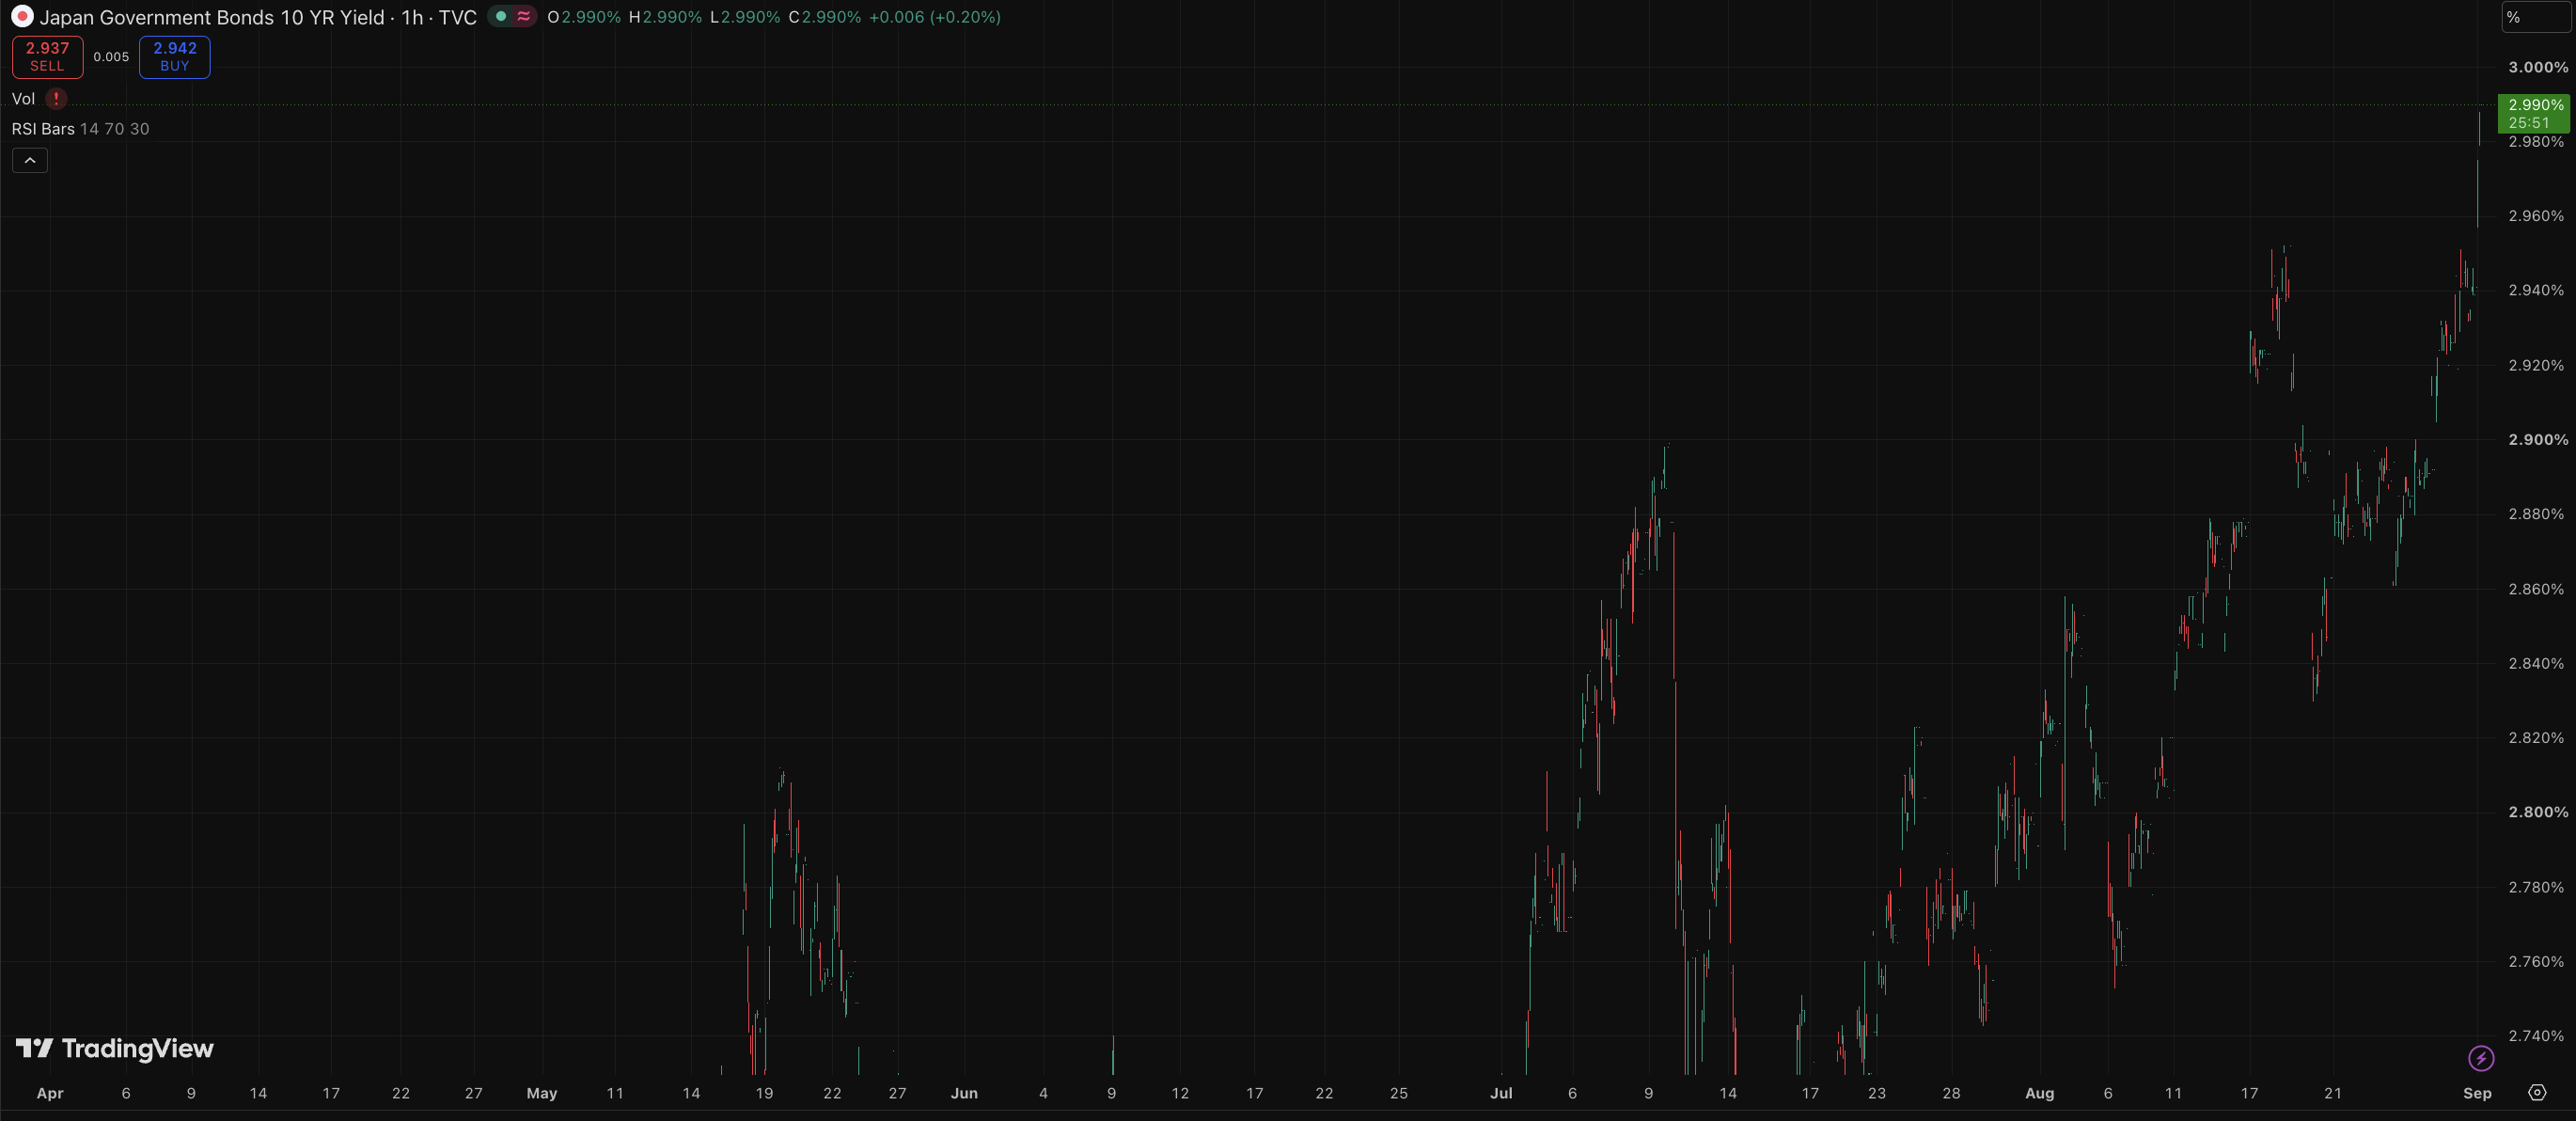
Selling was broad rather than concentrated. The two-year yield reached a 31-year high of 1.75% and the five-year set a fresh record at 2.21%. The 20-year finished at 3.83% and the 40-year at 4.20%.
The Ministry of Finance sells about ¥2.6 trillion of 10-year paper on Tuesday, with 30-year supply following later in the week. Demand at the previous 10-year sale was the weakest in a year.
| Indicator | Latest reading |
|---|---|
| Japan 10-year bond yield | 2.95% — highest since Sept. 1996 |
| Japan 20-year bond yield | 3.83% |
| Japan 30-year bond yield | 4.14% |
| Japan 40-year bond yield | 4.20% |
| Japan 2-year bond yield | 1.75% — 31-year high |
| BOJ policy rate | 1.00% |
| USD/JPY | ~159.7 |
Markets price roughly an 87% chance of a 25 basis point increase to 1.25% in September, against about 23% before the BOJ’s July meeting. Deputy Governor Ryozo Himino kept the door open to a move this month in a speech last week. A Reuters poll of economists now has the bank tightening faster than previously assumed.
A single move to 1.25% accounts for only a small share of the 132 basis point rise in the benchmark over twelve months. The balance reflects a shifting view of the terminal rate, with some forecasts now reaching 1.75%.
Japan’s policy rate crossed 1% in June without settling the argument over where it stops.
Headline inflation ran at 1.9% in July and unemployment fell to 2.4%, while underlying price pressures remained firm. Tokyo inflation excluding fresh food and energy reached 2.0% in August. Import costs are also rising again, with Brent above $90 and the yen remaining weak.
Deflation once made exceptionally low long-term yields sustainable because investors expected little persistent erosion in purchasing power. That backdrop has changed.
Firms continue to pass through higher costs, wage growth has remained resilient, and buyers of long-dated JGBs are demanding greater compensation for inflation, duration and uncertainty over where Japanese rates ultimately settle.
Budget requests from ministries for fiscal 2027 are expected to reach ¥140 trillion, well beyond the previous record of ¥122.3 trillion.
Prime Minister Sanae Takaichi has said she aims to cap issuance near ¥40 trillion, while the finance ministry expects debt-servicing costs to rise 17% to a record ¥36.64 trillion, reflecting an assumed interest rate of 3.8%, a 29-year high. Debt exceeds 200% of gross domestic product.
Capital spending, including software, rose 1.6% year on year in the second quarter, against a median forecast for a 0.3% decline. Sales gained 5.9% and current profits jumped 24.6%. The figures feed into revised GDP due on 8 September, after preliminary data showed the economy expanding at an annualised 1.1% pace.
Growth remains modest, but corporate balance sheets are not signalling the kind of stress that would clearly justify delaying further normalisation while underlying inflation pressures remain firm.
The 30-year yield rose 1.5 basis points to 4.135%, closing the month roughly 15 basis points higher. The 40-year finished just above it at 4.20%.
Over twelve months, the 10-year has risen further than the 30-year, pointing to policy repricing rather than a pure fiscal event. Over the past month the super-long sector has outpaced the benchmark, and that is term premium rebuilding rather than rate expectations.
Investors holding 30-year Japanese paper are absorbing three separate risks at once: inflation that no longer mean-reverts to zero, an issuance profile that grows with each supplementary budget, and the absence of a price-insensitive buyer at the long end. Each demands compensation.
The currency trades near 159.79 per dollar. That follows an eventful summer: the yen slid to 163.73 in late July, its weakest in roughly four decades, prompting the first coordinated US-Japan yen-buying intervention since 1998. The pair has since recovered much of the intervention-driven decline.
Higher domestic yields should narrow the rate disadvantage that has weighed on the currency. The arithmetic is less generous than it looks. The Federal Reserve’s benchmark sits at 3.50% to 3.75%, and US 10-year yields are 4.72%, with hawkish remarks from Fed Chair Kevin Warsh feeding bets on a US rate hike in September.
A spread of roughly 175 basis points on ten-year paper still favours the dollar. Retail interest in dollar to yen conversion has picked up alongside the currency’s slide, but carry positioning unwinds on relative moves, not absolute levels. Japanese yields need to close the gap faster than American ones for the yen to find durable support.
The scale of the shift is easier to grasp against the sequence that preceded it. Japan cut policy rates to zero in 1999, adopted quantitative easing in 2001, moved to negative rates in 2016 and pinned the 10-year through yield curve control from that year until the framework was dismantled in 2024.
For most of that period the central bank was the marginal buyer, and the benchmark yield reflected an administered price rather than a market one. A 3% 10-year yield was considered nearly unthinkable as recently as two years ago, and the benchmark has more than tripled over that span.
What is being priced now is not a single hike but the removal of an entire monetary architecture.
Tuesday’s auction result is the immediate test, followed by 30-year supply later in the week, revised GDP on 8 September and the BOJ decision on 18 September. Budget negotiations for fiscal 2027 will run alongside, as will intervention risk if the currency weakens through 160 again.
If the 10-year holds at or above 3% through those events, the market is accepting a structurally higher Japanese rate regime and global investors will reprice the yen funding trade accordingly.
If yields retreat sharply after the auctions clear, the move looks more like positioning and supply indigestion than a permanent repricing. One strategist’s framing captures the split: normalisation carrying a warning label, with 3% the level where dip-buying begins to outweigh momentum selling.