Published on: 2026-08-27
Updated on: 2026-08-27
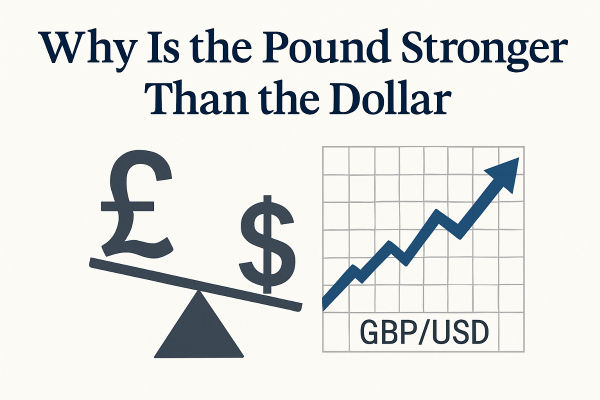
Sterling has climbed through the summer. GBP/USD touched 1.3676 on 21 August, its highest print since February and roughly 3.4% above the June low, and the advance has been steady rather than a single-session spike.
The domestic backdrop hardly looks like the foundation for a powerful currency rally. Unemployment has climbed to 4.9%, payrolled employment has been drifting lower for two years, and the IMF expects the economy to expand just 1.0% in 2026. Long-dated gilts yield 5.73%, among the heaviest borrowing costs in the G7.
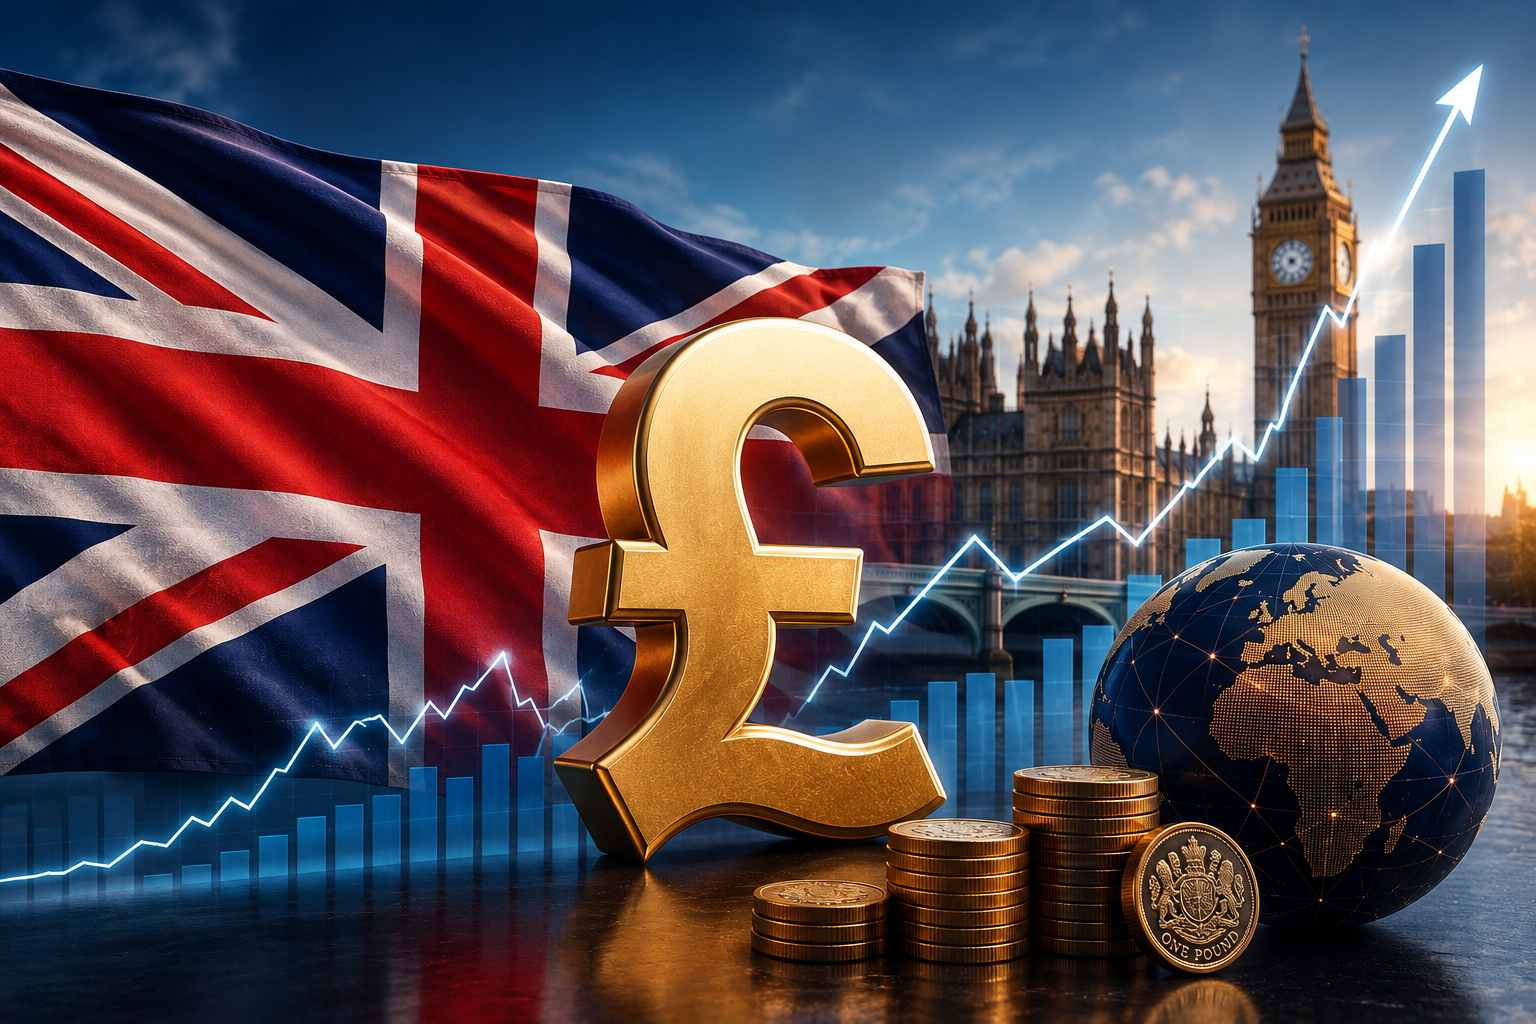 Weak growth, a cooling labour market and expensive government borrowing are the textbook ingredients of a falling currency, not a rising one. That contradiction dissolves once you understand what an exchange rate actually prices. So why is the British pound still so strong in 2026?
Exchange rates price the expected path of policy, not today’s setting. Bank Rate has not moved all year, yet the MPC went from four cut votes in February to three hike votes in July.
Where inflation comes from decides whether a central bank must respond. July’s rise to 2.9% was energy, while services inflation eased to 3.4%.
Sterling’s real yield edge is against the euro, worth about 150 basis points, not against the dollar, where the policy gap is close to zero.
A trade-weighted check separates currency strength from counterpart weakness. GBP/USD is up around 3.4% from its June low; sterling’s index only about 1.3%.
There is no single exchange rate for the pound. Every quoted pair is a ratio of two currencies, so a rising number can mean sterling strengthened, the other side weakened, or both at once.
A broader read comes from the trade-weighted effective exchange rate index, which the Bank of England builds by weighting each bilateral rate by its share of UK trade. The euro carries 40% of that index, the dollar 21%. A move against the dollar therefore reaches the index at about a fifth of its face value, while the same move against the euro counts for twice as much.
Run that check on 2026 and the rally shrinks.
| Measure | 2026 performance / level | What it tells us |
|---|---|---|
| GBP/USD | About 1.36 in late August. The 1.3676 high on 21 August was the strongest since February, roughly 3.4% above the June low of 1.3141, but still below January’s 1.3867 peak. | The most visible part of sterling’s rally, but also the most influenced by US dollar weakness. |
| GBP/EUR | Around 1.1675, versus 1.1461 on 2 January. It peaked near 1.1828 in mid-July before pulling back. | Sterling is up roughly 1.9% against the euro in 2026, showing some genuine GBP-specific strength. |
| Sterling effective exchange rate | Around 106.14 in mid-August, versus 104.83 on 1 January, within a 2026 range of roughly 104.12–106.93. | Broad sterling is up only about 1.3%, showing that GBP/USD makes the overall rally look stronger than it really is. |
Sterling is strong, but the strongest-looking part of the move is concentrated in GBP/USD.
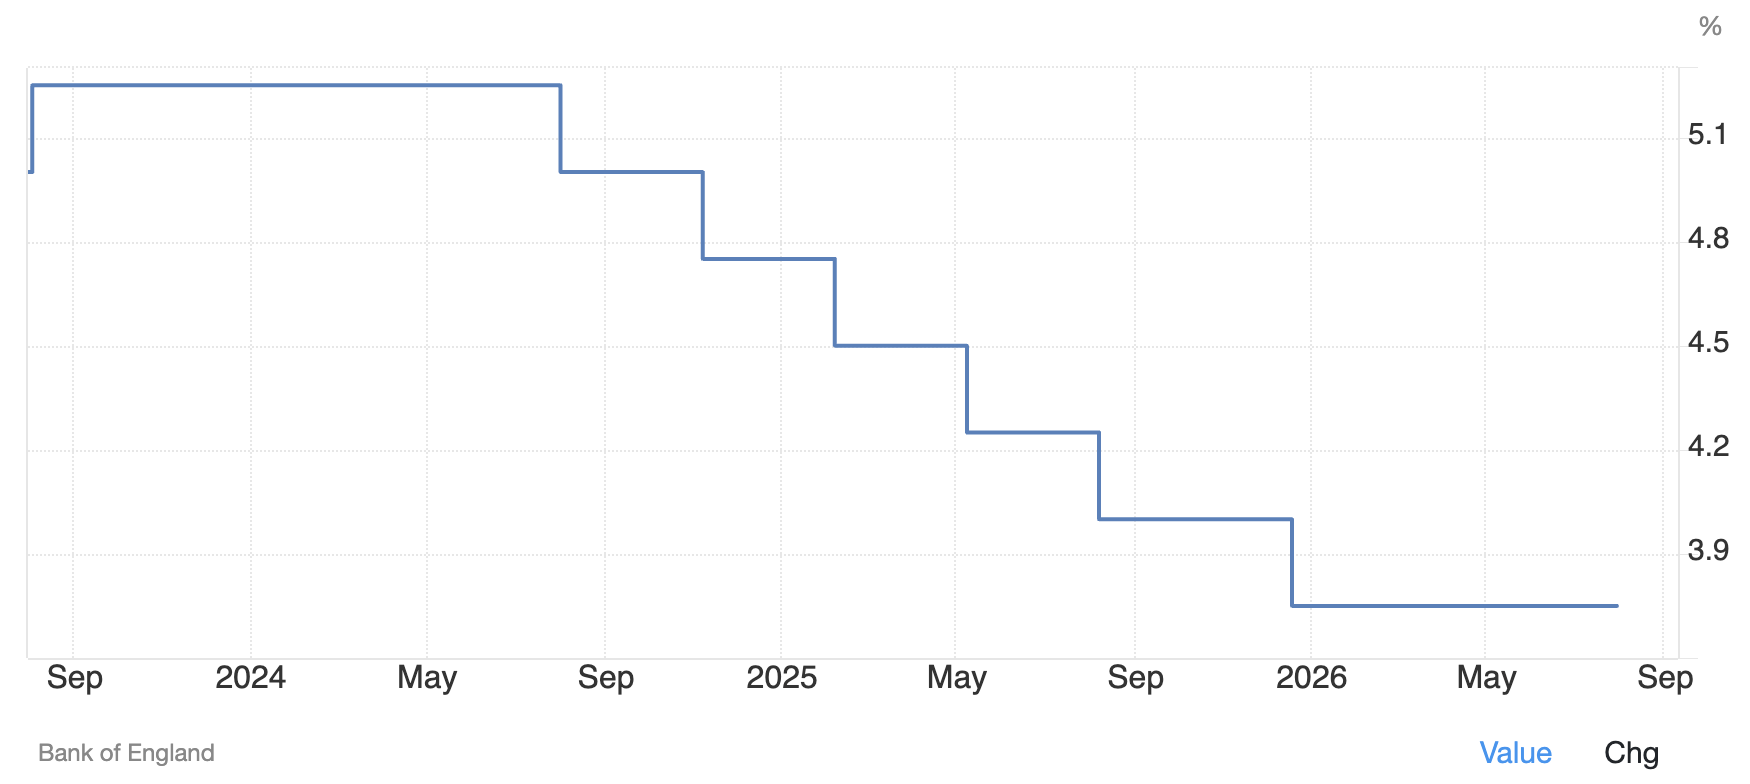
Bank Rate is 3.75% today. It was 3.75% in February. The pound rallied anyway, and understanding why is the single most useful thing in currency analysis.
Returns on short-dated sterling assets track the expected path of UK rates, not today’s setting. When markets revise that path higher relative to other economies, sterling assets become more attractive and the currency adjusts in the same session, long before any meeting delivers the change. By the time a rate decision lands, the currency has usually finished responding to it.
The MPC voting record traces the 2026 revision. In February, four of nine members wanted Bank Rate cut to 3.5% and a spring cut was consensus. The Middle East conflict then drove energy prices higher, and the dissent reversed: one hike vote in April, two in June, three in July. The headline decision was “hold” every time.
Market pricing flipped from expecting further easing at the start of the year to assigning a substantial probability to renewed tightening by late summer. That reversal, not the unchanged 3.75%, is what sterling has been trading.
The practical lesson is to read the split, not the decision. It shows how the balance of risk inside the Committee is shifting before the headline rate moves, which is why a currency can jump on a decision that changed nothing.
Which leaves the question of why the path was revised. Inflation stopped falling.
Not all inflation carries equal weight for a currency. What counts is whether it obliges the central bank to act. Demand-driven inflation, where households are spending freely and firms can pass on wage costs, almost always does. Supply-driven inflation from an energy shock may not, because it works as a tax on activity that monetary policy cannot influence and that fades on its own.
The difference turns on second-round effects: whether one-off cost increases feed into wage settlements and general price-setting. If they do, a temporary shock becomes a persistent one and rates have to rise.
July’s UK data sits precisely on that fault line. CPI rose to 2.9% from 2.6%, but almost the entire increase came from Ofgem’s 13% energy cap rise, while services inflation, the cleanest read on domestic pressure, eased to 3.4%. The Bank expects CPI to peak near 3.2% in the fourth quarter.
So sterling is supported by an inflation problem that is uncomfortable at home and unresolved analytically. That support holds only while the MPC cannot rule second-round effects out.
A hawkish repricing survives only if the economy can bear it. The principle here is that markets trade surprises, not levels: an economy expanding 1% when 0.5% was forecast supports its currency more than one expanding 2% when 3% was expected, because only the gap between outcome and expectation is unpriced.
Britain has landed on the right side of that gap repeatedly this year without being strong. Output grew 0.6% in the first quarter and 0.4% in the second, and August’s composite PMI reached a four-month high of 52.5 against forecasts for a fall.
The full-year picture stays modest: the IMF forecasts 1.0% growth for 2026, upgraded from 0.8% in April.
Growth has been sturdy enough to remove the argument for cutting, not sturdy enough to attract capital on its own merits. Those are different jobs, and only the first one was needed.
Interest rate differentials pay a return, and that return pulls money across borders.
The gap is clearest against Europe. Bank Rate is 3.75% against the ECB’s 2.25% deposit rate, and it widens along the curve, with 10-year gilts at 4.99% versus roughly 3.2% for German Bunds. Against the dollar there is almost no policy gap at all, the Fed holding at 3.50% to 3.75%.
A carry trade borrows in the lower-yielding currency and holds the higher-yielding one, pocketing the difference. That buying is a genuine source of demand for sterling.
It is also fragile, and the arithmetic shows why: a 150 basis point annual pickup is wiped out by a 1.5% adverse move in spot, which sterling can deliver inside a week. Carry works while volatility stays contained and unwinds abruptly when it does not.
One distinction is worth carrying beyond this year. Yields that rise because growth and policy are firm attract capital; yields that rise because lenders doubt a government’s finances repel it. Britain’s long end contains both, which is how a single yield can be read as a reason to buy sterling or a reason to avoid it.
Which brings the article to the question it has been circling: how much of this is sterling at all?
Three tests separate a currency’s own strength from its counterpart’s weakness. Check the other legs. Check the trade-weighted index. Check the sequencing of the move against the news calendar.
All three point the same way. Sterling’s gains this month cluster against the dollar, yen, and yuan, while it has lost ground to the rand, Canadian dollar, and Australian dollar, which is not the signature of a broad rally. The trade-weighted index barely shifted through August. And the timing is dated: cable accelerated after 19 August, when the US Treasury said it would at least double its buybacks of long-dated debt, driving the dollar index to its weakest since May.
Note what this was not. The Fed held on 29 July with three members dissenting in favour of a hike, so the policy gap had not shifted in sterling’s favour. This was a US long-end yield and fiscal story.
Would sterling look this strong without it? Probably not to the same degree.
A currency held up by expectations carries a particular vulnerability: expectations can be withdrawn faster than they were built. Pricing a hike out takes one session. Pricing it in took five months. The downside is quicker than the upside, and four things could set it off.
Rate pricing unwinding is the nearest. Markets carry a hike by December, yet 56 of 64 economists in an August Reuters poll expected no change all year. When market pricing and forecaster consensus diverge that far, one side is wrong, and the 17 September meeting is where the Bank arbitrates.
Labour market deterioration is the slower risk. Unemployment has moved from 4.7% to 4.9%, vacancies have fallen to 707,000, and private-sector pay growth is the weakest since 2020. Without wage pressure, the second-round effects the hawks fear cannot form.
Fiscal credibility is the sharpest. The 28 October Budget will test which kind of yield the gilt market is being paid, and a long-end selloff driven by borrowing worries takes the currency down with it.
A dollar recovery is the simplest. Much of August’s move could reverse on nothing British at all.
The pound is strong in 2026 because markets abandoned their assumption that UK rates were heading down. Energy-led inflation delayed the return to easier policy, growth held up well enough to make that repricing credible, and relatively high yields paid investors to wait.
The nuance is that GBP/USD flatters the move. Sterling’s trade-weighted index has gained around 1.3% this year while cable ran more than twice that from its June low, with dollar weakness supplying much of the difference.
The next stage of the pound’s 2026 story depends less on whether Britain suddenly becomes stronger and more on whether the Bank of England’s newly hawkish pricing survives.