Published on: 2025-12-26
Stock market gains are not a single number until the inputs are defined. A gain can mean a simple change in share price, or it can refer to total return, which includes dividends and reflects trading costs.
The same investment can show different “gains” depending on whether income, fees, and cash flows are counted.
Accurate calculations start with two records:
What the investor paid and received, including costs, and
The cost basis is tied to the specific shares sold.
In the U.S.The Internal Revenue Service explains that basis is generally the purchase price plus purchase costs, such as commissions. It also outlines how the basis is tracked when shares are bought at different times.
A stock’s most complete “gain” is its total return: price change plus any income received, typically dividends. FINRA describes total return as the change in value plus income collected, and it treats that as a more accurate measure than price change alone.
This matters because dividends are not “extra.” They are part of what shareholders receive, and ignoring them can materially understate long-term results for many stocks.
The denominator in a percentage gain must align with the actual investment. FINRA’s investor guidance on ROI stresses starting with the total cost of the investment, including investment fees, and for stocks, also including dividends alongside price appreciation in return calculations.
A clean rule is: if money left the account to establish and maintain the position, it belongs in “cost,” and if money arrived because of the position, it belongs in “return.”
“How to calculate stock market gains” can mean different targets:
Unrealized gain (still holding): current value minus current cost basis.
Realized gain (after selling): net sale proceeds minus adjusted cost basis of shares sold.
Total return (performance): price change plus dividends, minus costs.
After-tax / real gain (economic result): total return adjusted for taxes and inflation.
Choosing the wrong definition is the most common reason investors get conflicting numbers from spreadsheets, broker screens, and tax forms.

For a straightforward buy and later sale with no dividends, the dollar gain is:
Dollar Gain = Sale Proceeds − Purchase Cost
If 100 shares are bought at $25 and later sold at $31, the price-only dollar gain is:
Purchase cost = 100 × $25 = $2,500
Sale proceeds = 100 × $31 = $3,100
Dollar gain = $3,100 − $2,500 = $600
Dollar gain answers “how much money,” but it does not standardize results across positions of different sizes.
Percentage gain converts the same result into a comparable rate:
Percentage Gain = (Dollar Gain ÷ Purchase Cost) × 100
Using the example above:
$600 ÷ $2,500 = 0.24 → 24%
This is the basic stock profit calculation many investors use, but it is incomplete if the stock paid dividends or the investor paid meaningful costs.
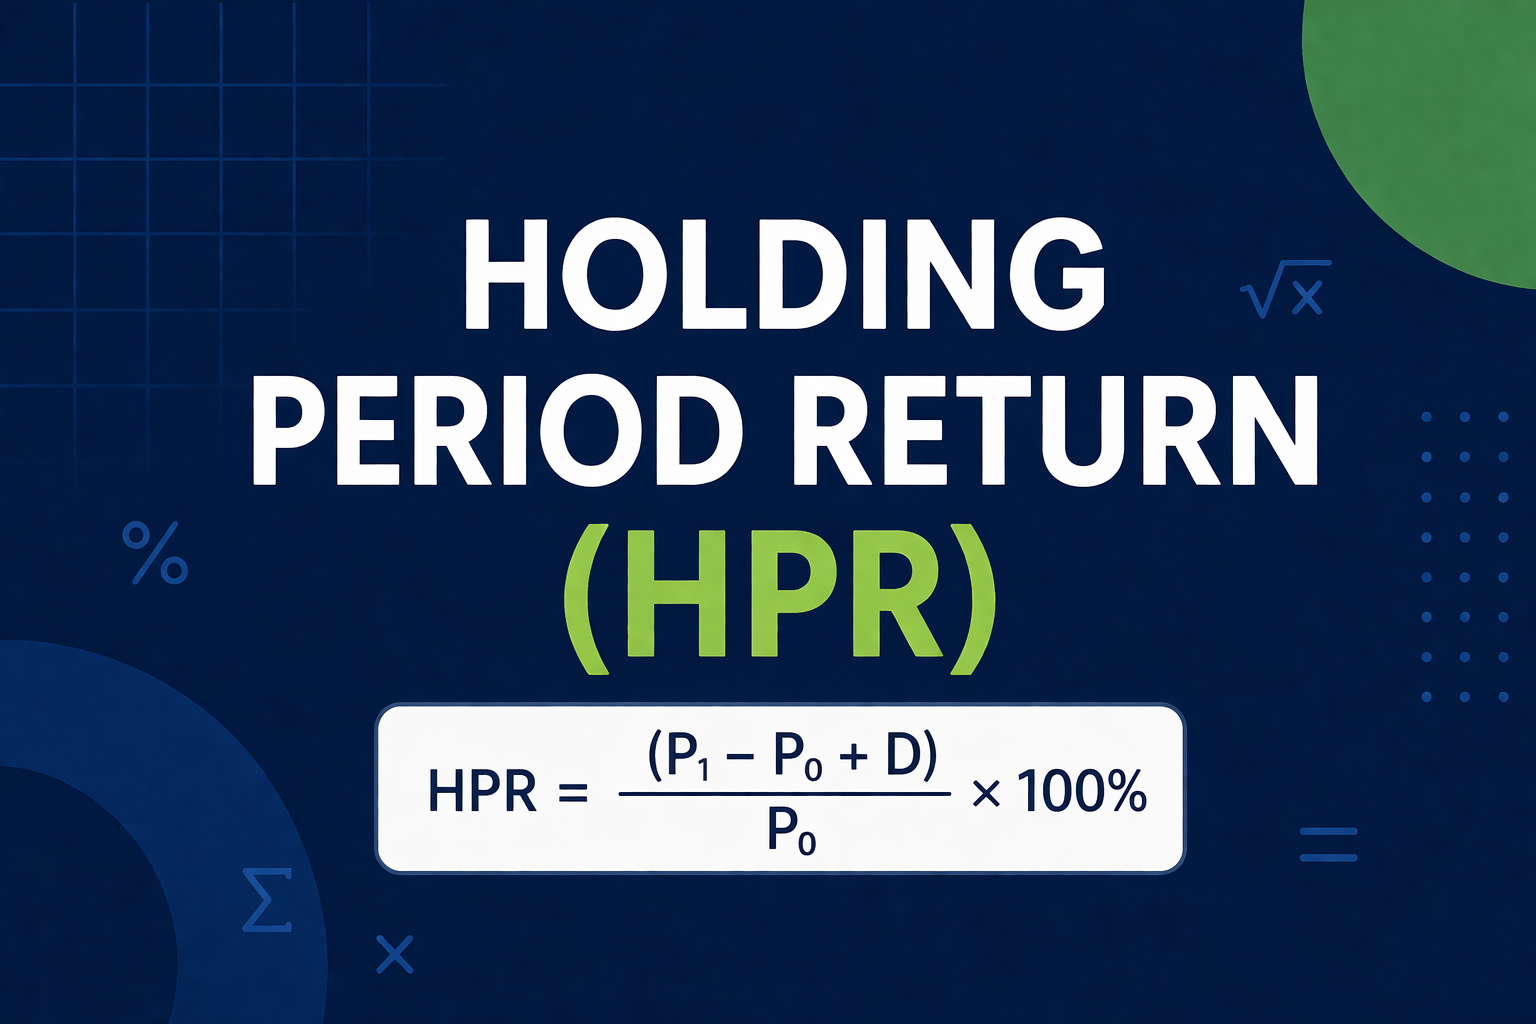
A practical total return formula for one holding period is:
Total Return (%) = [(Ending Price − Starting Price) + Dividends Per Share − Costs Per Share] ÷ Starting Price × 100
FINRA’s examples of investment return calculations explicitly add dividends to the change in value and, for ROI, incorporate investment fees.
This single formula is the backbone of most “calculate stock returns” workflows. The only difference across investors is how carefully dividends, commissions, taxes, and other frictions are recorded.
When the same stock is bought multiple times at different prices, each purchase creates a tax lot with its own basis. A quick “average price paid” can be useful for informal performance checks, but it can be wrong for realized gains if the sold shares came from a specific lot.
In the U.S., the IRS notes that if shares were purchased at various times and prices, the investor should be able to identify the specific shares sold, and if not, FIFO may apply in many cases. (IRS)
For any sale, the realized gain is:
Realized Gain = Net Sale Proceeds − Adjusted Cost Basis Of Shares Sold.
“Net sale proceeds” should reflect commissions and regulatory/transaction charges that reduce proceeds. “Adjusted cost basis” should reflect purchase costs and any basis adjustments tracked for the lot.
A strong practice is to calculate realized gain per lot, then sum across lots for the trade. That removes ambiguity and aligns better with broker tax reporting.
If a broker reports basis information, it can simplify reconciliation. The IRS explains that certain securities are treated as covered securities, and brokers are required to provide basis information on Form 1099-B for those covered securities.
Even with broker reporting, investors benefit from maintaining their own lot ledger for auditability, especially if shares moved between brokers or were received via corporate actions.
Dividends can be received as cash or automatically reinvested through a dividend reinvestment plan (DRIP). If dividends are reinvested, the investor is effectively making additional purchases, often including fractional shares.
The IRS explains that in a dividend reinvestment plan, the dividend is used to purchase additional shares, and the basis of the stock received through the plan is the cost of those shares plus any adjustments, such as commissions.
Splits change the share count and per-share basis, but they do not create a gain by themselves. The IRS states that stock splits generally do not create a taxable event and that the investor’s total basis does not change, but the basis must be reallocated across the new share count.
For performance measurement, split-adjusted pricing or position-value tracking avoids false “gains” that appear when an unadjusted price series is used.
Many market data services publish an adjusted close that reflects corporate actions (commonly splits and dividends). That can be helpful for analyzing historical returns because it reduces distortions from events that change per-share price without changing ownership economics.
A practical caution is that adjusted close often assumes a dividend adjustment convention that may not exactly match an investor’s cash handling, taxes, or reinvestment timing. It is best treated as an analytical tool, not a replacement for account-level records.
Portfolio-level gains become tricky when the investor adds or withdraws cash. Time-weighted methods are designed to measure investment performance while reducing the impact of external cash-flow timing.
Professional performance standards commonly distinguish time-weighted from money-weighted returns, and CFA Institute materials explicitly cover comparing these approaches and evaluating portfolios using them.
A common implementation is to break the timeline into sub-periods between cash flows, compute each sub-period return, and compound them.
Money-weighted return (often expressed as IRR) reflects the timing and size of contributions and withdrawals. If most capital is added before a decline, the money-weighted result will look worse than time-weighted performance, even if the underlying holdings performed identically.
Money-weighted return answers “what did the investor’s dollars experience,” while time-weighted return answers “how did the portfolio perform independent of cash-flow timing.”

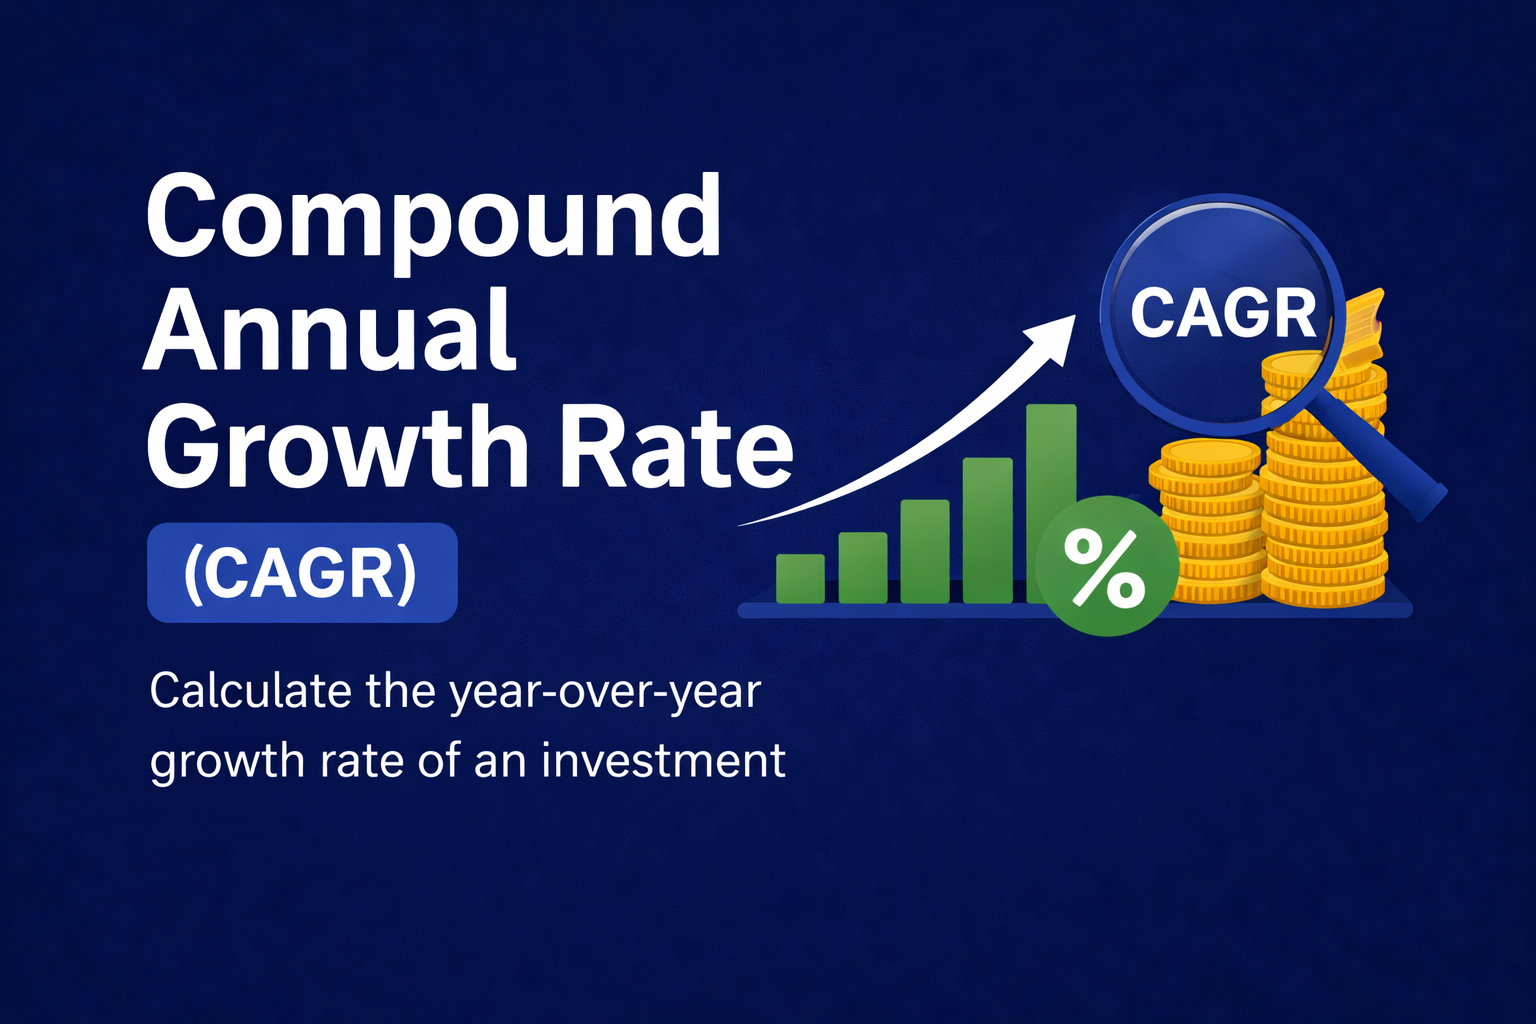
For multi-year holdings with a clean start and end value, CAGR (compound annual growth rate) is a standard way to annualize:
CAGR = (Ending Value ÷ Beginning Value)^(1 ÷ Years) − 1
FINRA provides an annualized return formula conceptually consistent with compounding a holding-period return across years.
CAGR is ideal for comparing investments over different time spans because it converts “since purchase” performance into an annual rate.
CAGR assumes one beginning value and one ending value. If the investor made regular contributions, reinvested unevenly, or withdrew funds, CAGR can be misleading. In those cases, time-weighted or money-weighted methods fit better because they explicitly incorporate cash-flow structure.
Two investors can hold the same stock and still end up with different net gains because of costs. The U.S. Securities and Exchange Commission’s investor bulletin on fees explains that fees and expenses may seem small but can have a major impact over time.
For stock market gains, common frictions include commissions, bid-ask spreads, account fees, advisory fees, and (if applicable) margin interest.
Tax rules vary by country, and investors should treat tax calculations as jurisdiction-specific. In the U.S., the wash sale concept can also change effective gains and losses when selling at a loss and repurchasing substantially identical securities within the defined window.
IRS training materials define a wash sale as selling securities at a loss and acquiring substantially identical securities within 30 days before or after the sale, with the disallowed loss generally added to the basis of the replacement shares.
A portfolio can show strong nominal gains and still lose purchasing power if inflation is high or if taxes and fees are heavy. Some glossary defines real return as what is earned after accounting for taxes and inflation, and notes that real returns are lower than nominal returns.
For long holding periods, reporting both nominal and real returns produces a more honest picture of what the gains can actually buy.
A simple spreadsheet can outperform many “quick calculators” because it makes assumptions explicit. Before building formulas, a short setup paragraph helps: the sheet should be able to reproduce broker statements and separate performance from cash flows.
Recommended columns for a stock-position ledger:
Date
Action (Buy, Sell, Dividend, Fee, Split)
Shares (+/-)
Price ($)
Trading Costs ($)
Cash Amount ($)
Lot ID (for buys)
Lot Basis Remaining ($)
Notes (corporate action details)
Useful formulas (expressed in plain form):
Price Return (%) = (Ending Price - Starting Price) ÷ Starting Price
Total Return (%) = (Ending Value + Dividends - Fees - Beginning Value) ÷ Beginning Value
Realized Gain ($) = Net Proceeds − Basis Of Shares Sold
CAGR (%) = (Ending Value ÷ Beginning Value)^(1 ÷ Years) - 1
The investor who can reconcile spreadsheet totals to broker cash flows, positions, and reported basis is the investor who can trust the “gains” number.
A fast checklist prevents most calculation errors:
Treating price return as total return and missing dividends.
Using the wrong lot basis after multiple buys.
Forgetting that splits change per-share basis but not total basis.
Ignoring costs that reduce returns over time.
Applying CAGR to a portfolio with large mid-period cash flows.
Use total return. Subtract the starting value from the ending value, then add dividends received and subtract costs such as commissions. Divide that net gain by the initial investment amount to express it as a percentage return.
Price return measures only the share price change. Total return includes the share price change plus dividends or other income received. Total return is the better measure of what the investor actually earned from holding the stock.
Track each purchase as a separate lot with its own cost basis. When selling, match the sold shares to specific lots (or the required default method) and calculate realized gain as net proceeds minus the basis of the shares sold.
No. A split increases the number of shares and reduces the price per share, but it does not change the investor’s total basis or create a gain by itself. The per-share basis must be adjusted to reflect the new share count.
Use time-weighted return to evaluate the strategy independent of cash-flow timing. Use money-weighted return (IRR) to reflect the investor’s personal experience based on when contributions and withdrawals occurred.
Differences usually come from missing dividends, fees, corporate-action adjustments, or lot matching. Broker-reported basis may reflect specific regulations and adjustments, while a spreadsheet may use simplified averages or ignore events like reinvested dividends.
Learning how to calculate stock market gains starts with one decision: measure total return rather than price change. Total return forces dividends and costs into the calculation, which is where most “too good to be true” gain numbers come from.
The second decision is structural: trade-level gains require a lot-level cost basis, while portfolio-level gains require a method that handles cash flows. With a clean ledger, the reported gain becomes explainable, comparable across time, and consistent with brokerage reporting.
Net gains are what investors keep. Fees, taxes, and inflation can change the real outcome even when the market result looks strong, so the most useful reporting shows both nominal performance and the real purchasing-power result.
Disclaimer: This material is for general information purposes only and is not intended as (and should not be considered to be) financial, investment or other advice on which reliance should be placed. No opinion given in the material constitutes a recommendation by EBC or the author that any particular investment, security, transaction or investment strategy is suitable for any specific person.