Published on: 2025-11-20
Updated on: 2025-11-20
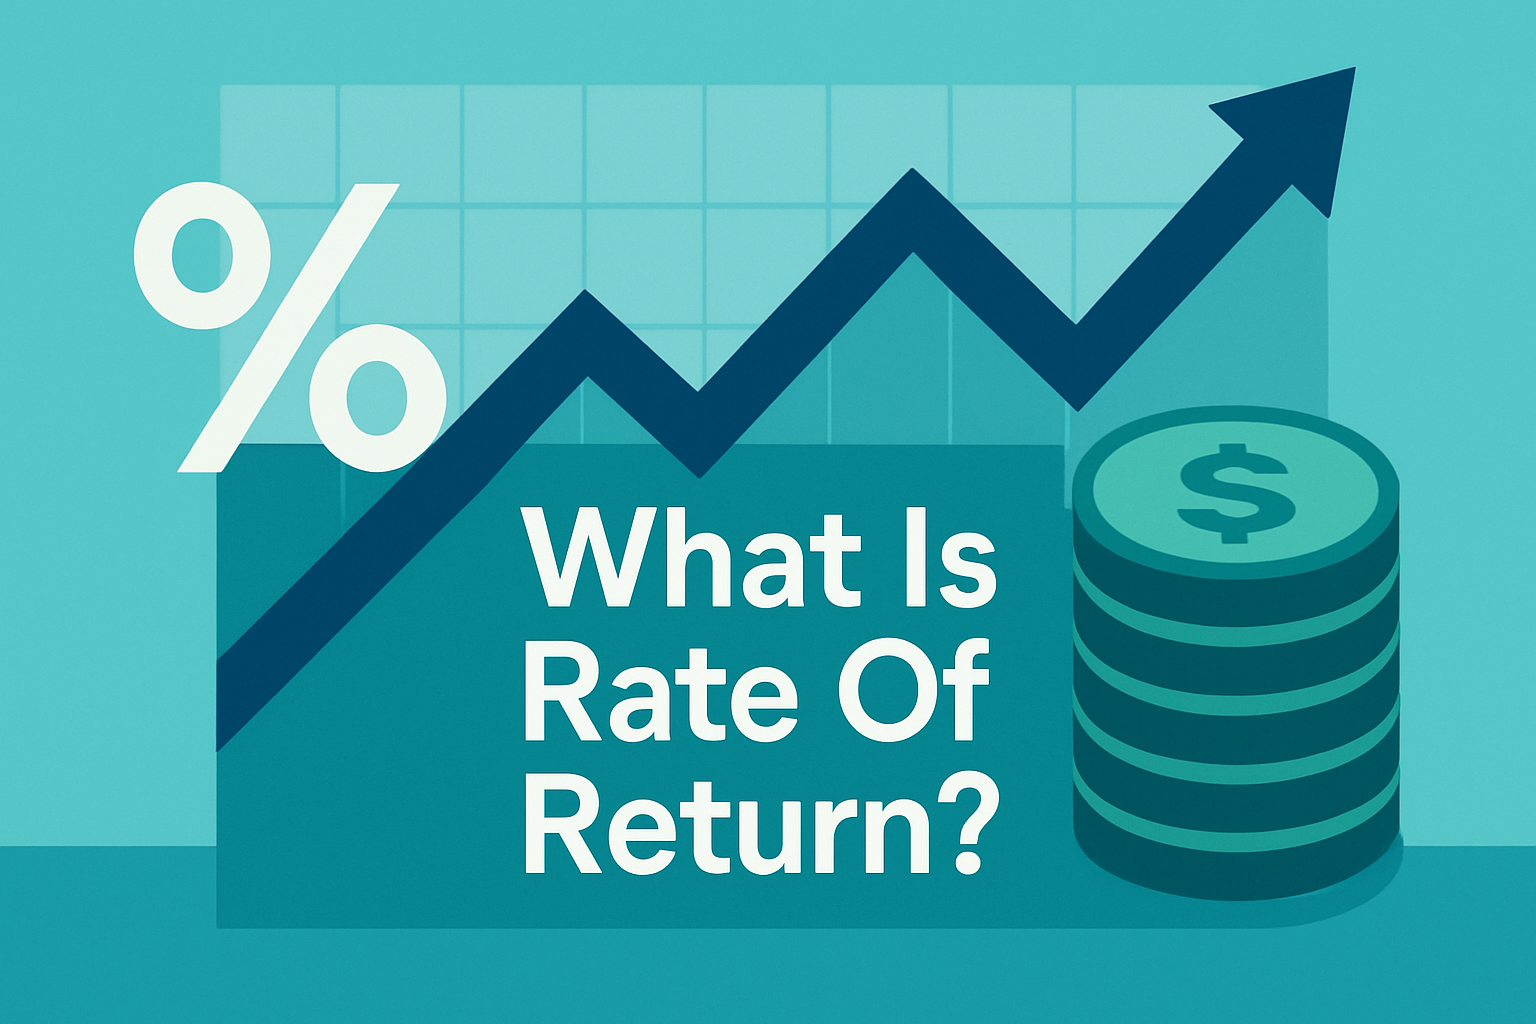
Every investor’s ultimate goal is simple: make your money work harder for you. But understanding whether your investments are really growing or just sitting idle can be tricky without the right perspective.
That’s where the concept of rate of return comes in. It’s the key metric that tells you how effectively your capital is performing, whether you’re dipping your toes into stocks, bonds, or even a savings account.
Grasping it early can mean the difference between confident financial decisions and costly guesswork.
Rate of return is the backbone of every performance conversation in the market. It tells you, in one clean number, how efficiently your capital is working.
Traders look at it the same way a portfolio manager looks at their daily profit and loss (P&L); not as a vanity metric, but as the compass pointing toward better decisions.
The idea itself is simple.
You invested a certain amount, the investment changed in value, and the percentage gain or loss represents your rate of return. What makes it powerful is how it connects to risk, strategy selection, and overall capital allocation.
At its core, rate of return measures the percentage change of an investment over a set time period. It doesn’t matter the instrument whether its stocks, crypto, bonds, ETFs, or currencies, the math stays the same.
If you buy an asset at 10,000 and later value it at 11,000, your return is 10%. A loss to 9,000 is a -10% return.
This percentage lets different assets speak the same language. A trader can compare a high-beta tech stock against a conservative bond fund because both report performance in the same terms.

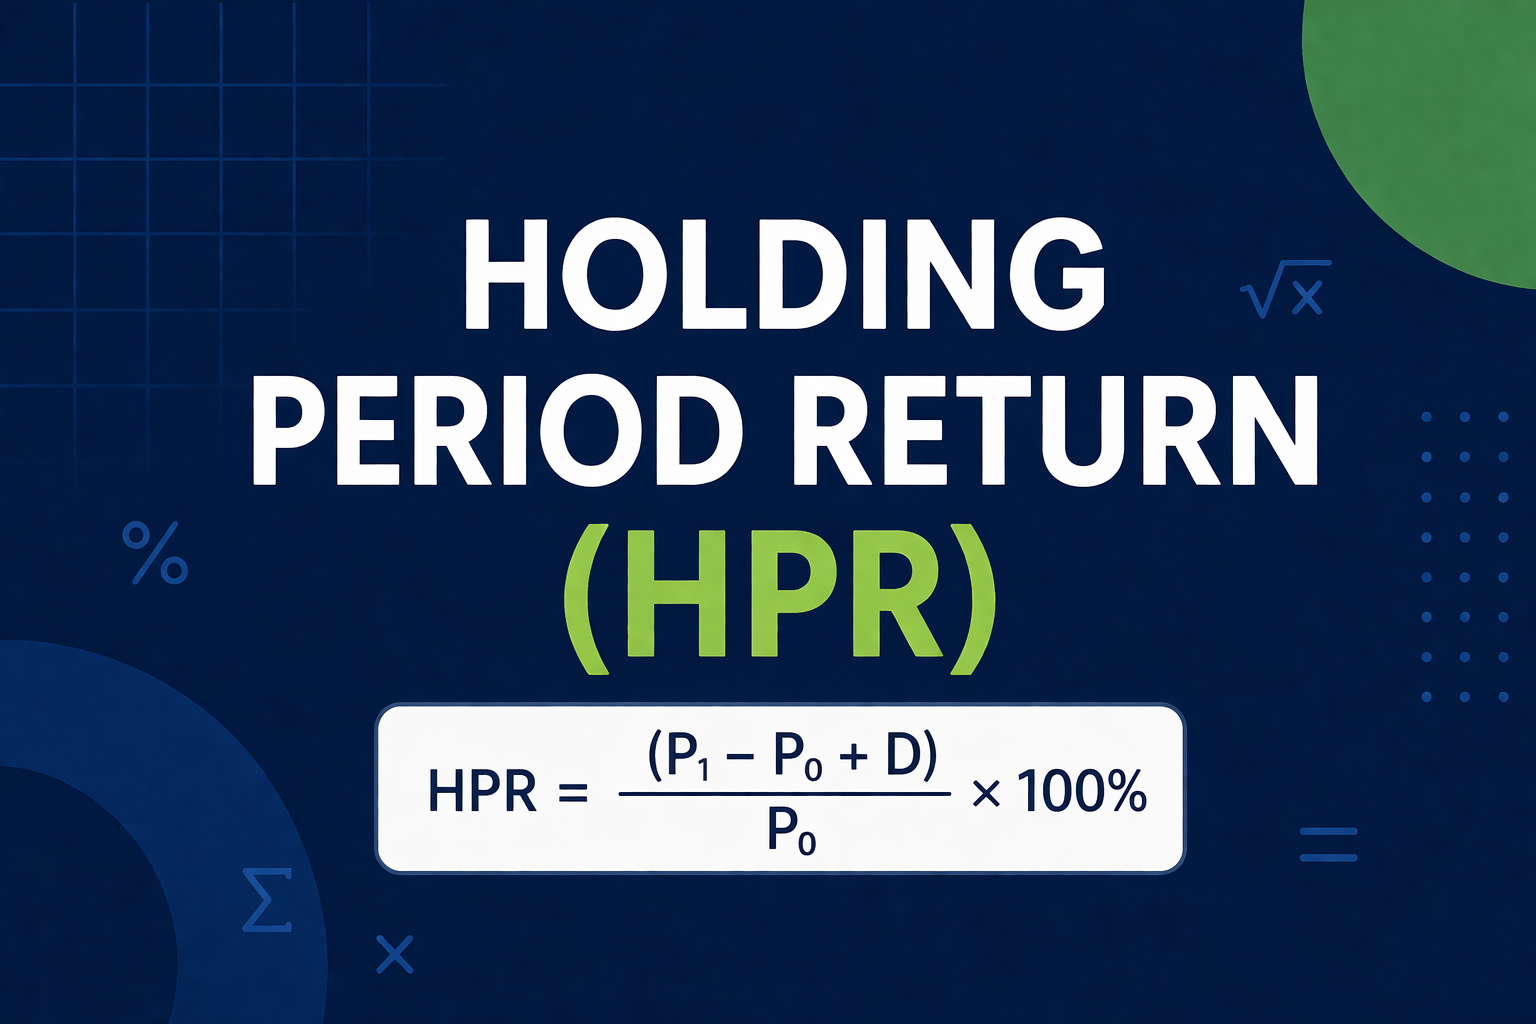
Here’s the simplest version you’ll ever need:
Rate of Return = (Ending Value – Starting Value) ÷ Starting Value
Think of it like checking the odometer on your investment: how far did your capital travel, and in which direction?
Most traders start with simple returns, but real performance evaluation happens with annualised returns. This adjusts your performance to a yearly pace and gives you a more realistic benchmark.
If you earn 5% in three months, that is not simply 20% a year. Annualisation accounts for compounding, producing a truer picture of how that return scales across the full calendar.

This is why professional reports always show annualised figures, because they strip out time distortions and give traders a level playing field for comparison.
This is the part beginners often miss. A positive return doesn’t automatically mean you made a smart decision. A 4% gain looks nice until you realise the benchmark index rose 12% over the same period. In relative terms, you underperformed.
Markets don’t reward the absolute number; they reward the number relative to the opportunity set.
Traders measure themselves against indices, volatility-adjusted benchmarks, or the performance of alternative strategies.
Each one uses the same concept, but in different contexts.
| Investment | Annual Rate of Return | Volatility (Price Swings) | Max Drawdown (Largest Loss) | Risk-Adjusted Insight |
|---|---|---|---|---|
| A | 20% | 5% | 8% | Steady growth with low risk; ideal for cautious investors. |
| B | 20% | 25% | 40% | Same return as A but much riskier; large losses could occur. |
Both investments delivered 20% returns, but Investment A achieved it safely, while Investment B’s path was highly volatile, exposing investors to potential stress and capital loss.
Evaluating risk alongside rate of return gives a clearer picture of whether the performance is truly sustainable.
A swing trader might track monthly returns to see whether market changes affect their hit rate.
A long-term investor compares multi-year returns to inflation and index performance.
A day trader reviews daily returns to measure whether position sizing is effective for his trading.
Focusing only on high returns
Ignoring timeframes
Overlooking fees and costs
Comparing apples to oranges
Neglecting risk metrics
Reacting to every fluctuation
Failing to adjust for market conditions
Even experienced traders can fall into traps if they focus solely on rate of return. High returns may look impressive, but without context, they can be misleading and risky. Often, higher returns come with higher volatility, which can lead to large losses if not managed carefully.
To avoid common mistakes, traders should:
Look beyond the headline return and examine risk metrics such as Sharpe ratio, volatility, and maximum drawdown.
Compare returns relative to the risk taken, not in isolation.
Assess performance across timeframes, positions, strategies, and market conditions to detect inconsistencies.
Account for fees, slippage, and other costs, which can erode net returns.
Avoid reacting to short-term fluctuations and instead focus on long-term, sustainable growth.
By keeping these precautions in mind, traders can ensure that their pursuit of profit is balanced, informed, and resilient, minimizing the chance of unpleasant surprises while building consistent performance.
It’s the percentage of profit or loss your investment earns over a specific period.
It shows how well your money is growing and helps you compare different investments.
Subtract what you invested from what you earned, then divide by your initial investment, and multiply by 100 to get a percentage.
Not always. Higher returns usually come with higher risk. It’s about balancing growth and safety.
Yes. If your investment loses value, the rate of return will be negative, indicating a loss.
No. It depends on when you buy, sell, and how much you invest. Timing and strategy matter.
Rate of return is a simple idea with immense strategic value. Once you understand how it fits into risk management and market structure, you’ll see why professionals treat it as a core indicator rather than a bragging point.
It’s a constant reminder that in markets, efficiency matters as much as outcome, sometimes even more.
Disclaimer: This material is for general informational purposes only. It should not be considered financial or investment advice, nor should it be relied upon as a recommendation. Copy trading involves risk, and past performance does not guarantee future results.


World's Best Broker