In technical analysis, indicators help traders interpret market behaviour. One such underrated but powerful tool is the Central Pivot Range (CPR) indicator.
Though it might not receive as much mainstream attention as moving averages or RSI, CPR has earned its place among seasoned intraday traders for its ability to reveal market trends, price reversal points, and intraday trading zones.
This comprehensive guide for beginners explains what the CPR indicator is, its calculation, and how traders utilise it for day trading and swing trading, as well as why it's gaining popularity in both stock and forex markets.
Understanding the CPR Indicator

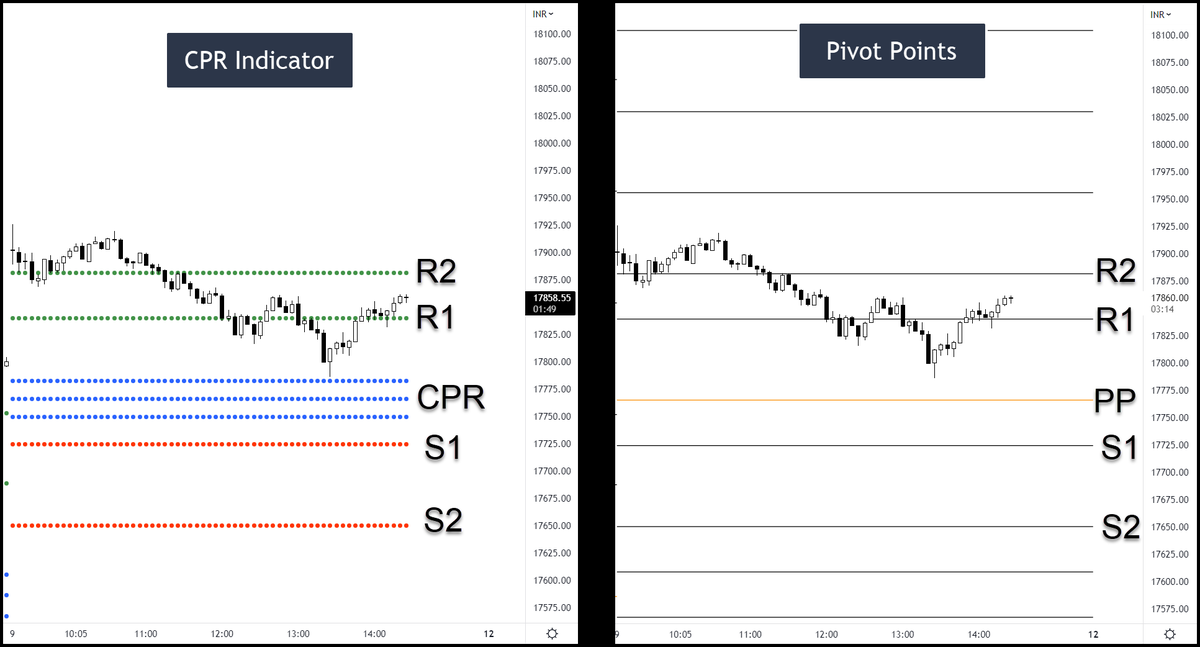
CPR stands for Central Pivot Range, a price-based indicator derived from daily high, low, and close prices. Unlike other pivot points that show a single level, CPR is a zone composed of three lines:
These levels help traders assess potential price movement directions and pinpoint robust support or resistance areas.
At its core, CPR reflects market consensus about a fair price range. The distance between TC and BC often indicates whether the market is likely to trend or consolidate.
How Is CPR Calculated?
The CPR calculation is straightforward. You only need the previous day's high, low, and close.
Central Pivot (P) = (High + Low + Close) / 3
Bottom Central (BC) = (High + Low) / 2
Top Central (TC) = (P × 2) – BC
These three values form a band on the chart. Traders use this band as a reference to gauge market sentiment and potential breakouts.
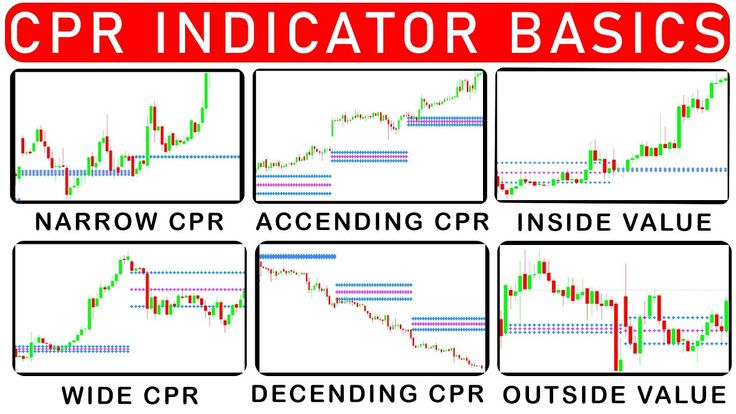
A narrow CPR range often indicates a high probability of trending movement. A wide CPR range suggests market indecision and possible consolidation.
How to Interpret the CPR Indicator in Real-Time Trading
1. Price Opening Above the CPR Range
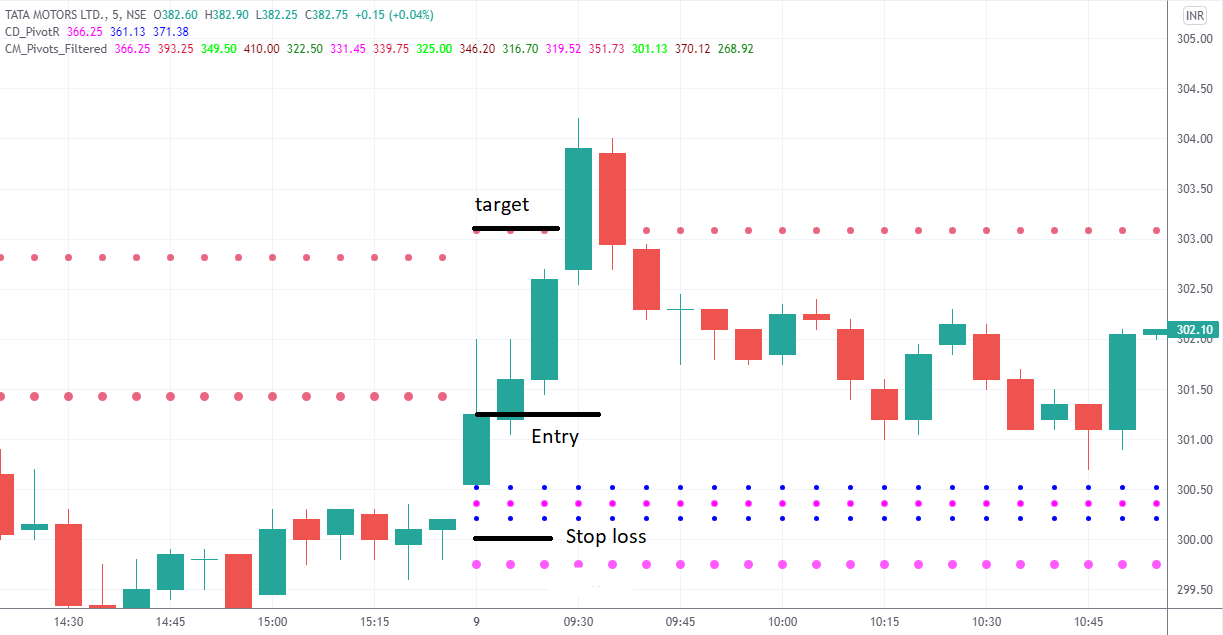
When the price opens above the CPR range, it generally indicates a bullish tone. Traders may look for long positions with stop-loss orders below the central pivot or BC line.
However, confirmation is crucial. If prices fall back into the range after a breakout, it may signal a false breakout or a reversal.
2. Price Opening Below the CPR Range
An opening below the CPR is often a bearish signal. Traders may take short positions anticipating price continuation to lower levels, especially if volume supports the move.
As with any signal, additional confirmation from price action or indicators such as RSI or MACD is advised.
3. Price Opening Inside the CPR Range
It suggests a sideways or range-bound market. In such cases, scalping or mean-reversion techniques are most effective, with traders entering at BC or TC points and targeting minor intraday gains.
Breakouts from the CPR zone, if supported by volume, can turn into strong trending moves. That's why some traders set alerts for price crossing TC or BC lines.
CPR in Different Markets
Stock Market
Intraday traders use CPR to plan trades around high-volume stocks. Since CPR reacts to recent price action, it works well for gap-up or gap-down days, helping traders identify key re-entry zones.
Forex Market
CPR is effective in major forex pairs, especially during the London and New York sessions. Traders plot CPR on 1-hour or 15-minute charts to scalp pips using precise support and resistance levels.
Commodities
For assets like gold, crude oil, and silver, CPR acts as a neutral bias zone. Breakouts beyond TC or BC with volume often indicate strong trends in commodity markets.
Types of CPR Setups Every Trader Should Know

1. Narrow CPR Setup
A narrow CPR means the range between TC and BC is tight. It typically occurs during low-volatility sessions and often precedes a big move. Narrow CPR days are considered breakout days, so traders watch closely for strong directional moves.
2. Wide CPR Setup
A wide CPR suggests high volatility in the previous session. On such days, markets are more likely to be range-bound, and breakout trades may fail. Scalping and reversal trades become more favourable here.
3. Trending CPR
If CPR levels are progressively moving higher day after day, the market is in a strong uptrend. Conversely, when CPR values continue to decline, the pattern is downward. Traders often look for pullbacks toward CPR levels as re-entry points.
4. CPR as a Magnet
When the price trades far from CPR but starts moving toward it during the day, many traders refer to CPR as a magnet zone. It is common when early moves get exhausted and the market gravitates back toward a mean value.
Using CPR with Other Indicators
Though CPR alone can offer valuable insights, combining it with other indicators improves trading accuracy.
Moving Averages help confirm direction when the price is above or below both CPR and key EMAs (e.g., 20 or 50 EMA).
Volume Indicators show whether a breakout from the CPR zone has strength behind it.
Bollinger Bands add volatility context; if bands widen during a CPR breakout, it confirms momentum.
MACD and RSI help identify overbought/oversold zones when price approaches CPR lines.
Blending CPR with 1 or 2 of these tools creates a more reliable trading system, especially for new traders.
Advantages and Disadvantages of the CPR Indicator
| Advantages of CPR Indicator |
Disadvantages of CPR Indicator |
| Easy to calculate and visualize |
Not effective during news-driven volatility |
| Identifies key support and resistance zones |
False breakouts may occur without confirmation |
| Useful across multiple markets: stocks, forex, commodities |
Lacks predictive power during unpredictable or low-volume sessions |
| Helps determine trend direction and consolidation phases |
Not suitable as a standalone indicator |
| Works well for intraday and short-term trading strategies |
May offer misleading signals in highly volatile or illiquid instruments |
| Does not require parameter optimization like RSI or MACD |
Relies on previous day’s data — may lag during rapid market shifts |
| Can be combined with price action and volume for stronger signals |
Narrow CPR zones can be traps if risk management is not properly applied |
| Offers visual clarity with clearly marked zones |
Platforms may require custom script if CPR isn’t available by default |
CPR Indicator Strategy for Beginners

Let's say you're trading a stock that closed at $100, with a high of $105 and a low of $95 the previous day.
Using CPR formulas:
P = (105 + 95 + 100) / 3 = 100
BC = (105 + 95) / 2 = 100
TC = (2 × 100) – 100 = 100
In this rare case, CPR is a single line (all three levels are the same), which can act as a very strong pivot point. Price is likely to bounce strongly from this line or break through with momentum.
This kind of setup is often followed by sharp movement in either direction and is ideal for breakout trades.
Conclusion
In conclusion, the Central Pivot Range (CPR) is a versatile, easy-to-use indicator that helps traders find direction, support/resistance levels, and trading zones with remarkable accuracy.
While it's not a holy grail, combining CPR with other tools and a solid risk management plan can significantly improve your trading outcomes.
Disclaimer: This material is for general information purposes only and is not intended as (and should not be considered to be) financial, investment or other advice on which reliance should be placed. No opinion given in the material constitutes a recommendation by EBC or the author that any particular investment, security, transaction or investment strategy is suitable for any specific person.


