Published on: 2026-08-28
Updated on: 2026-08-28
Gold has gained about 14% in August 2026 and trades near $4,590 an ounce, even as the odds of a Federal Reserve rate hike have risen rather than fallen. The rally’s clearest catalyst was not the Fed but the US Treasury, which doubled its long-end bond buybacks on August 19 and helped push the dollar to a three-month low.
July inflation ran hotter than forecast, three policymakers voted for an immediate hike, and futures still put a December increase near 73%. A non-yielding asset is not supposed to gain 14% into that.
Fed Chair Kevin Warsh delivers his first Jackson Hole keynote on August 28 at 10:00 a.m. ET. His remarks will test which of the two forces is setting gold’s price.
The rally is a repair, not a record. August’s 14% gain still leaves gold roughly 18% below its January spot peak near $5,600.
The Fed got more hawkish, not less. July’s 9 to 3 hold drew three dissents for an immediate hike, and December hike odds are running near 73%.
The turn came from Treasury, not the Fed. Long-end buyback caps doubled to at least $4 billion per operation on August 19.
Yields recovered. The dollar’s drop proved more durable. Long yields returned to pre-announcement levels within two days, and gold tracked the dollar rather than the curve.
Two rates are pulling apart. The Fed is holding policy restrictive at the short end while Treasury intervenes at the long end, on the same day it reported US debt past $40 trillion.
Gold entered August near $4,027 an ounce, roughly 28% below the spot record of about $5,600 set on January 29, 2026, after five months of correction. From there it climbed steadily, touched a three-month high near $4,697 earlier this week, and now sits around $4,590.
The 14% figure therefore describes a repair rather than a breakout, and gold remains close to 18% below its January peak. The rally’s notable feature is timing: it ran through a month in which the case for higher US rates strengthened.
Gold pays no coupon, so higher policy rates raise the cost of holding it. August offered no relief on that front.
Headline PCE, the Fed’s preferred inflation gauge, rose 0.2% in July against a 0.1% consensus, leaving it at 3.7% year on year. Core rose 0.2% and 3.3% year on year, matching expectations. Neither improved on June.
The committee had already split over it. July’s meeting held the federal funds target at 3.50% to 3.75% by a vote of 9 to 3, with the Cleveland, Minneapolis and Dallas presidents dissenting in favor of an immediate quarter-point increase.
It was the first time three policymakers dissented in the same hawkish direction since September 2016. Minutes released on August 19 showed many participants expected tightening to become necessary if inflation did not decline, and some doubted conditions were restrictive enough at all.
Fed funds futures are pricing roughly a 40% chance of a September hike, while the probability of at least one increase by December remains above 70%. Gold spent the month rallying into a Fed that was getting more hawkish, not less.
The strongest leg of the rally did not follow a Fed speech. It followed a Treasury press release.
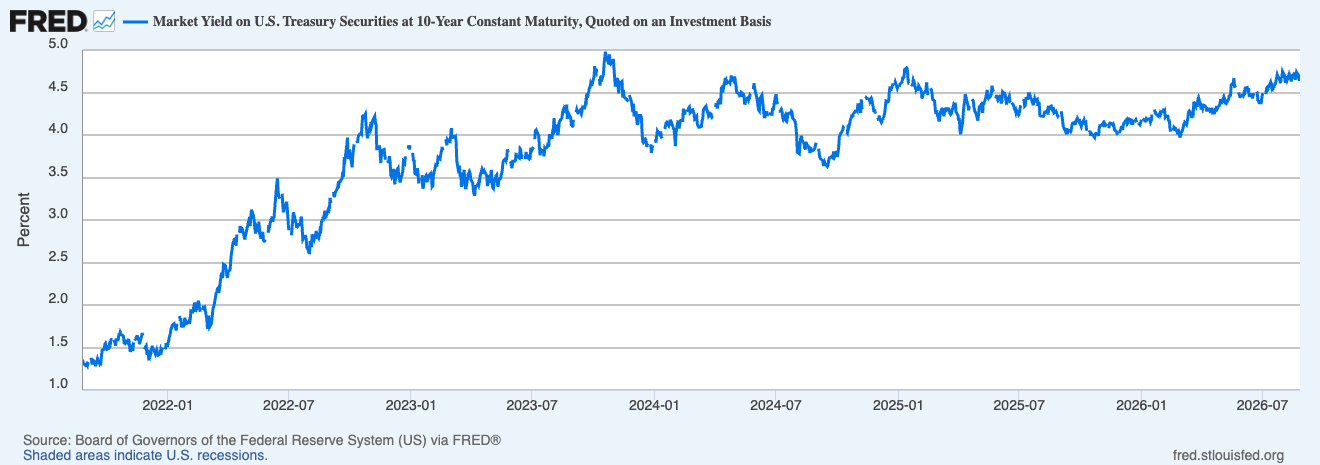
Treasury said it would at least double the maximum size of its liquidity-support buyback operations in the 10-year to 20-year and 20-year to 30-year sectors, from $2 billion per operation to at least $4 billion, effective September 9 and running through November 4.
It moved into a bond market that had just repriced badly. The 30-year yield closed at 5.31% on August 17, its highest since 2007, and the August auction cleared at 5.216%, the highest since 2001. Treasury was expanding purchases of long-dated paper on the same day it reported that total US debt had passed $40 trillion for the first time.
Long-dated paper rallied on the news, and so did gold. Only one of them held.
| Market | Reaction on August 19 | Position by August 21 |
|---|---|---|
| 10-year yield | Down about 5.7bp to 4.647% | Back to roughly 4.70% |
| 30-year yield | Down 9bp to 5.196% | Back toward 5.25% |
| Dollar index | Fell sharply | Three-month low near 98.5, off about 1% on the week |
| Gold | Jumped | Gain intact |
The yield trade unwound inside two days. The dollar’s decline proved more durable, and gold tracked the dollar. What buyers were paying for was not cheaper money, because money did not get cheaper. They were paying for a Treasury willing to intervene at the long end, which is a question about the dollar rather than about the funds rate.
The shorthand that higher rates are bearish for gold assumes there is one rate. There are two, and in August they moved apart.
Short-term rates belong to the Fed, and the two-year Treasury is largely a forecast of the funds rate. Long-term yields belong to the market and carry more than policy expectations: term premium, deficit and issuance pressure, foreign demand, and how confident investors are that a debt stock of that size can be absorbed at current prices.
The Fed held policy restrictive at the short end and signaled it might tighten further. Treasury moved at the long end, where the strain sits. One arm of Washington was keeping the cost of holding gold high while the other was raising doubts about the currency gold is priced in.
Buybacks are debt management, not quantitative easing. They create no central bank reserves, and Treasury calls them liquidity support. But markets price intent alongside mechanics, and intervening at the long end while inflation runs at 3.7% invites a debasement reading.
Gold is where that reading gets expressed. Traders should understand how an XAUUSD position is constructed before sizing exposure to such an unsettled argument.
Positioning alone would not have held the price. Fund demand turned with it.
Global gold ETFs took in about $6.4 billion in the week to August 21, adding 46.7 tonnes in their strongest weekly inflow in 10 months, after a $3 billion July inflow that broke two straight months of redemptions.
GLD took in $1 billion in a single day, showing how quickly such flows can reverse. Central banks bought 289 tonnes in the second quarter, a record for a second quarter, though official demand is only one of gold’s price drivers and does not set direction alone.
By contrast, investment in ETFs, bars and coins fell to 262 tonnes in the second quarter, with ETFs shedding 45 tonnes, while total demand including OTC was flat year on year at 1,269 tonnes. The turn in flows is weeks old, not quarters. Sanctions pressure on Iran and firmer oil added a separate safe-haven bid, so no single cause explains the move.
Warsh became Fed Chair on May 22, 2026, and this is his first Jackson Hole keynote in the role. He resists forward guidance on principle, which narrows what markets can expect to learn.
| Warsh signal | Reaction to watch | Reading for gold |
|---|---|---|
| Clearly hawkish | Hike odds, yields and the dollar rise together | Tests whether the $4,580–$4,600 area holds |
| Balanced or vague | Little repricing in rates | Leaves the fiscal and dollar theme in charge |
| Softer than feared | Hike odds and the dollar ease | Removes one of gold's two headwinds |
The rate path may not be the most valuable thing he says. Whether he addresses the Fed’s relationship with an increasingly active Treasury speaks to the mechanism that drove gold in August.
Two dates will test the argument. The first buyback under the higher cap runs September 9, and the FOMC meets September 15 and 16.
If long-end yields stay elevated through the larger operations, the fiscal-credibility case that carried gold in August gets stronger. If they fall and hold while inflation cools, the debasement bid loses its best evidence.
The 2026 gold price forecast sets out where these forces could leave the price, and China’s record gold reserves cover the reserve side of the same debt story.