Last Week's Snapshot:
Gold: $4,060, +3.2% weekly, +54% YTD
S&P 500: −2.4% weekly (Trump tariff shock)
WTI crude: $62, −4% weekly
Silver hit a fresh all-time high of $51.60 on 13 October, extending a rally that saw the metal break $50 for the first time in 45 years.
Multiple forecasters now see a path to $60 and beyond if silver maintains its current momentum, with analysts at Emkay Global targeting $60-62 by early 2026 and HSBC raising its long-term forecasts on structural supply deficits.
The metal has surged over 70% year-to-date, significantly outpacing gold's 54% advance, as safe-haven demand intensified amid escalating U.S.-China trade tensions and persistent Fed rate-cut expectations. [1]
Breaking: Silver Surges to $51.60 Record on 13 October
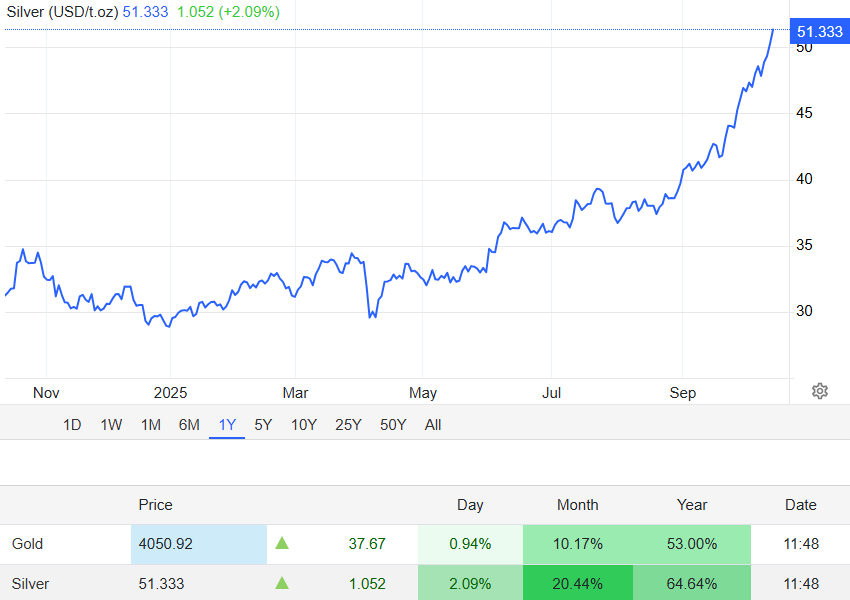
Silver jumped more than 2% on Monday 13 October to hit a new all-time high of $51.60 per ounce in Asian trading, extending its record-breaking run as the London short squeeze intensified and U.S.-China trade tensions drove fresh safe-haven demand.
The breakthrough marks the third time in five days the metal has set a new peak, with prices surging from the initial $50 break on 9 October through $51.30 on Wednesday to today's fresh record. As of midday, spot silver was trading at $51.27, up 1.9% for the session and extending its year-to-date gain to more than 64%.
Why Silver Hit a New High Today:
Asian markets opened with renewed trade war concerns after Friday's Trump tariff threat, boosting safe-haven flows into precious metals
London short squeeze intensified overnight, with silver lease rates spiking and physical tightness forcing covering
Gold's push above $4,060 provided additional momentum, lifting the entire precious metals complex
Industrial demand from solar panel production and tech sectors continues to tighten physical supply
The rally occurred despite Trump's softened rhetoric on Sunday evening, when he posted "it will all be fine" regarding U.S.-China relations, which triggered a modest rebound in equity futures but failed to dampen haven demand for bullion.
Trump Tariff Threat Triggers $2 Trillion Selloff
The week ending 12 October concluded with a violent Friday selloff that wiped $2 trillion from U.S. equity markets in a single session after President Trump threatened a "massive increase of tariffs" on Chinese products, with rates potentially reaching 100% effective 1 November.
| Index |
Weekly Move |
Friday 11 Oct |
Cause |
| S&P 500 |
−2.4% |
−2.7% |
Trump 100% tariff threat |
| Dow |
−2.7% |
−2.7% |
Trade war escalation |
| Nasdaq |
−2.5% |
−2.5% |
Risk-off rotation |
The tariff shock sent investors fleeing into bonds, gold, and silver, with precious metals hitting fresh records whilst Treasury yields fell as safe-haven bids intensified.
The S&P 500 plunge marked its worst day since early April, erasing gains from a seven-day winning streak that had pushed the index to near-record levels earlier in the week.
Asian markets opened Monday sharply lower as trade war fears spread, with Chinese stocks tumbling from decade-high levels reached in early October.
Silver Breaks $50: Can it Reach $60 Next?
Silver's breakthrough above $50 per ounce during the week ending 12 October represents the first time the metal has traded at these levels since January 1980, when the Hunt Brothers' attempted corner drove prices to an inflation-adjusted peak near $140.
| Silver Performance |
Data |
| Current (13 Oct) |
$51.27, intraday high $51.60 |
| Week ending 12 Oct |
+4.5% |
| YTD 2025 gain |
+64% |
| Previous all-time high |
$49.95 (January 1980) |
| Gold/silver ratio |
~78 (compressed from 85) |
Silver Price Targets and Roadmap:
Near-term support: $50 (psychological floor), $48-49 (pullback zone if profit-taking emerges)
Next resistance: $52 (breakout confirmation level), $55-57 (Fibonacci extension targets)
Bull case target: $60-62 by Q1 2026 (Emkay Global forecast, assumes industrial demand holds)
Extended scenario: $65-70 if gold reaches $4,500 and industrial supply deficits persist (HSBC scenario)
The move was amplified by a short squeeze in London silver markets, where traders caught betting on lower prices were forced to cover positions, intensifying upward pressure.
Industrial demand from solar panel production in China and tech sector usage has tightened physical supply, whilst ETF inflows surged as retail investors chased the breakout.
Analysts at Emkay Global Financial Services argue silver can gain another 20% from current levels, whilst HSBC raised its silver price forecasts for 2025-2027, citing structural supply deficits and robust industrial consumption as key supports.
Silver vs 1980: What's Different Now
Today's record high occurs under fundamentally different conditions than the 1980 peak, suggesting greater sustainability.
| Metric |
1980 Peak |
2025 Breakout |
Difference |
| Nominal price |
$49.95 |
$51.60 |
+3% higher |
| Inflation-adjusted |
~$140 (2025 dollars) |
$51.60 |
−63% in real terms |
| Primary driver |
Hunt Brothers manipulation |
Industrial demand + Fed cuts |
Fundamentally driven |
| Market structure |
Attempted corner |
Global supply deficit |
Sustainable trend |
| Industrial demand |
Limited tech usage |
Solar, EV, 5G sectors |
Structural growth |
The current rally is underpinned by genuine supply-demand imbalances rather than speculative excess, though analysts warn that silver typically moves 1.7 times faster than gold in both directions due to its smaller market size, meaning sharp pullbacks remain possible.
Gold at $4,060 Lifts Silver Rally
Gold's sustained strength provides critical support for silver's advance, with the yellow metal posting its eighth consecutive weekly gain.
Gold added 3.2% for the week ending 12 October, closing above $4,060 per ounce
Eighth consecutive weekly gain driven by Fed rate-cut expectations, central bank buying, and trade war concerns
Real yields compressed below 1.5% support the haven bid for both gold and silver
Gold/silver ratio at 78 (down from 85 in September) shows silver catching up, with a historical mean near 60, suggesting further upside potential
Cross-asset Weekly Performance
Commodities, currencies, and bonds:
Oil: WTI crude fell 4% to $62 per barrel on trade war demand fears and potential recession concerns
Dollar: USD Index declined 0.8% for the week as safe-haven flows favoured precious metals over the greenback
Treasuries: 10-year yields fell approximately 12 basis points to 4.03% on risk-off flight to quality buying
Bitcoin: Cryptocurrency declined roughly 3% as risk assets were sold during the tariff shock [estimated from market trends]
Fed Minutes Signal Rate Cuts Despite Shutdown
The FOMC Minutes from the 16-17 September meeting, released Wednesday 8 October, showed policymakers agreed that "downside risks to employment had increased" and that policy should be "recalibrated to support labour market conditions," reinforcing dovish expectations.
The language confirmed broad Committee support for further rate cuts, with markets pricing 96% odds of a 25-basis-point reduction at the 28-29 October meeting to 3.75-4.00%.
However, with the government shutdown now in its third week, key data releases including the September jobs report and October CPI remain delayed, forcing the Fed to rely on private-sector proxies such as ADP payrolls and initial jobless claims rather than official Bureau of Labour Statistics data.
The data blackout increases policy uncertainty but hasn't altered the Committee's easing bias, which continues to support lower real yields and precious metals demand.
Week Ahead: Bank Earnings and China Trade Data
The third-quarter earnings season launches in earnest on Tuesday, 14 October, with JPMorgan Chase, Goldman Sachs, Wells Fargo, and Citigroup all reporting before the U.S. market open.
| Date |
Event |
Consensus / Watch Points |
| Tue, 14 Oct |
JPMorgan Chase Q3 |
EPS $4.83, revenue $44.66B (+10.5% y/y) |
| Tue, 14 Oct |
Goldman Sachs Q3 |
EPS $10.93, revenue $14.01B (+10.4% y/y) |
| Tue, 14 Oct |
Wells Fargo, Citigroup Q3 |
Focus on loan growth, credit quality |
| Wed, 15 Oct |
UK GDP (August) |
Growth pulse for Europe amid slowdown concerns |
| Thu, 16 Oct |
US retail sales (September) |
If the shutdown ends, the key consumer demand signal |
| Fri, 17 Oct |
China trade data (September) |
Export growth, surplus; watch for tariff impact |
| Ongoing |
US PPI, jobless claims |
Alternative data during the government shutdown |
Key Themes for The Week of 14-17 October:
Can J.P.Morgan and Goldman Sachs earnings beat expectations and lift the financials sector after Friday's selloff? [2]
Will China's September trade data show export weakness ahead of the 1 November tariff deadline?
Does UK GDP signal a broader European economic slowdown that could prompt ECB action?
Will Trump clarify his tariff stance or continue escalating rhetoric against China?
Analysts expect JPMorgan to post strong results driven by higher interest rates and robust consumer activity, with profit forecasts rising 2.1% in the past month. Goldman Sachs is expected to benefit from solid investment banking revenues and market-making gains during Q3 volatility, though rising expenses remain a concern.
Four Risks to Silver's $60 Path
Tariff escalation (high probability, high impact): Trump's 100% tariff threat scheduled for 1 November could spark recession, crushing industrial silver demand faster than safe-haven buying compensates.
Silver volatility (medium probability, medium impact): The metal moves 1.7 times faster than gold in both directions; profit-taking after the $50 breakout could test support at $48-49 even within a bull trend.
Shutdown resolution (low probability of impacting silver): Data restoration would reduce one source of uncertainty, but doesn't change the Fed's easing path or structural haven demand drivers.
Fed policy pivot (low probability): Any unexpected hawkish shift would hurt precious metals by lifting real yields, but dovish Minutes and ongoing shutdown suggest easing bias remains intact.
Conclusion
For the week ahead, expect heightened volatility around Tuesday's big bank earnings, which will set the tone for Q3 corporate profit expectations and provide clues on consumer and business health heading into year-end.
China's trade data on Friday will be critical for gauging the impact of tariff threats on export activity, with any deterioration likely to boost precious metals whilst pressuring industrial commodities and equities.
Gold and silver remain the preferred hedges against trade war escalation and policy uncertainty, with silver offering greater leverage to any upside move but also carrying higher downside risk if sentiment improves.
Traders should watch the $50 level in silver as key support, with a sustained break below signalling profit-taking, whilst a push above $52 would target the next resistance zone at $55-57 on the path toward $60. [3]
Disclaimer: This material is for general information purposes only and is not intended as (and should not be considered to be) financial, investment or other advice on which reliance should be placed. No opinion given in the material constitutes a recommendation by EBC or the author that any particular investment, security, transaction or investment strategy is suitable for any specific person.
Sources
[1] https://edition.cnn.com/2025/10/09/investing/silver-record-high
[2] https://www.cnbc.com/2025/10/12/earnings-playbook-gs-jpm-kick-off-the-season.html
[3] https://economictimes.indiatimes.com/news/international/us/silver-price-today-silver-price-sees-unprecedented-surge-above-51-now-experts-warn-silver-may-swing-1-7x-faster-than-gold-what-investors-should-know-about-silver-price-predictions/articleshow/124453312.cms
