Published on: 2026-08-21
Updated on: 2026-08-21
Silver closed at $68.03, its strongest settlement since June 17, yet it remains 40.89% below January’s $115.08 peak. That gap is unusually large for a market heading toward a sixth consecutive annual supply deficit. Industrial demand is weakening, above-ground inventories remain available, and financial flows now have more influence over how far the recovery can run.
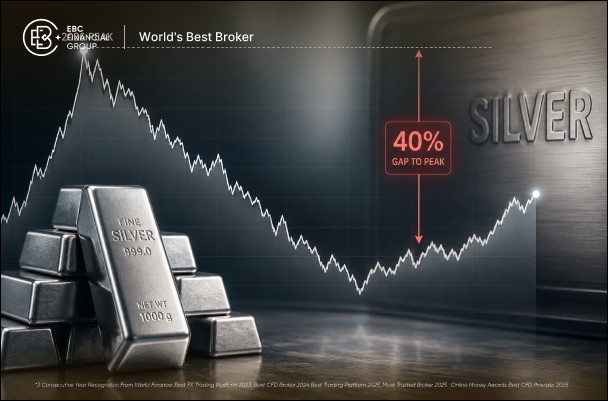
Silver settled at $68.03 after a 6.39% two-day gain, reaching its highest close in more than two months while remaining roughly 40% below January’s peak.
The 2026 silver market is forecast to run a 46.3 Moz deficit, extending the supply shortfall into a sixth consecutive year.
Industrial demand is expected to fall about 3%, largely because solar manufacturers are using less silver per cell despite continued capacity growth.
Nearly 74% of mined silver comes as a by-product of other metals, limiting how quickly mine supply can respond to higher silver prices.
Silver now faces resistance between roughly $69 and $72, with the 200-day average providing the stronger test of whether the rebound can extend.
The rebound accelerated after the US Treasury doubled long-term debt buybacks to at least $4 billion per operation, briefly weakening the US Dollar and pulling long-term yields lower. Silver continued higher even after yields recovered, reducing the move's dependence on falling rates alone.
Renewed US-Iran tensions and firmer oil prices added support through safe-haven demand and inflation risk. Bond-market volatility, Dollar weakness and geopolitical risk are therefore working together rather than leaving the rally tied to a single headline.
January’s record run developed under far more extreme conditions than today’s recovery. Product shortages, higher dealer premiums, strong exchange-traded product flows and leveraged futures and options demand pushed silver above $121 intraday as physical liquidity tightened.
The reversal was equally violent. Institutional deliveries removed about a quarter of COMEX inventory during the physical run, while repeated CME margin increases forced leveraged positions to shrink. The January 30 emergency margin hike helped accelerate a two-session collapse.
Reaching those highs again would require more than clearing $72. It would require another substantial expansion in investment demand, renewed physical tightness, or both.
A sixth annual supply deficit does not mean the world is running out of silver. Above-ground inventories continue to cover the gap between annual supply and demand, with London vaults holding 28,213 tonnes of silver at the end of July, 0.5% more than a month earlier.
The deficit is widening even as total demand falls.
| Metric | 2025 | 2026 forecast |
|---|---|---|
| Total supply | 1,090.4 Moz | 1,066.4 Moz |
| Total demand | 1,130.6 Moz | 1,112.6 Moz |
| Industrial demand | 657.4 Moz | 639.6 Moz |
| Physical investment | 217.7 Moz | 257.6 Moz |
| Market balance | -40.3 Moz | -46.3 Moz |
Supply is forecast to contract faster than demand, widening the annual shortfall from 40.3 Moz to 46.3 Moz. Existing stocks are absorbing that difference, leaving the market structurally tight without supporting claims that readily available silver has already been exhausted.
Nearly 74% of mined silver comes from operations primarily producing other metals. Primary silver mines accounted for only 26.1% of global output in 2025, with copper, lead, zinc and gold operations supplying most of the remainder.
Most mine supply therefore does not respond directly to the silver price. A copper or zinc operation will not materially expand production solely because its by-product silver becomes more valuable if the economics of its main metal do not justify expansion.
Global mine production is still forecast to slip to 844.1 Moz in 2026. Recycling can react faster to elevated prices and is expected to rise 7% to 211.3 Moz, making secondary supply the quicker source of additional metal.
Photovoltaic silver consumption is forecast to fall from 186.6 Moz in 2025 to 151.0 Moz in 2026, a 19% decline. Solar manufacturers are reducing silver use per cell and substituting cheaper materials as high silver prices raise manufacturing costs.
Solar capacity can therefore keep expanding without requiring more silver. AI infrastructure, automotive electronics, and power-grid investment continue to support electrical demand, although they are not expected to fully offset the decline in photovoltaic use.
Industrial silver demand is forecast to fall about 3% to 639.6 Moz in 2026. Electrification is still growing, while the amount of silver required to support that growth is falling.
With industrial demand weakening, financial demand is becoming increasingly important to any attempt to extend the rebound. The iShares Silver Trust held about 491.1 million ounces on August 20, while physical bar and coin demand is forecast to rise 18% to 257.6 Moz in 2026.
Fund flows can change much faster than mine production, allowing financial demand to alter silver’s direction long before physical supply can adjust.
Silver has recovered above its shorter-term averages, while the 100-day and 200-day averages remain overhead.
| Signal | Reading |
|---|---|
| 14-day RSI | 66.58 |
| 100-day average | $69.47 |
| 200-day average | $72.36 |
RSI at 66.58 shows strong momentum without yet crossing the conventional 70 overbought threshold. Silver is testing the 100-day average near $69.47, while the 200-day average around $72.36 presents the more important longer-term barrier.
A sustained move above $72.36 would provide the clearest evidence that the recovery is extending beyond a short-term rebound. Failure there would leave much of January’s decline unrepaired despite the recent momentum.
Silver combines precious-metal demand with heavy industrial use inside a substantially smaller market than gold. Changes in interest rates, the US Dollar, manufacturing expectations and financial flows can therefore hit silver simultaneously, producing larger percentage swings. January’s 60% LBMA price surge followed by a rapid collapse showed how sharply that smaller market can reprice.
It is both. Silver trades as a monetary and precious metal, while industrial fabrication accounts for more than half of annual demand. Its price therefore responds to macro conditions alongside manufacturing, electronics, solar power and electrification trends.
Yes. A structural deficit can support silver over time without controlling short-term price direction. Higher real yields, a stronger US Dollar or a reversal in financial flows can outweigh physical tightness for weeks or months, as January’s reversal demonstrated.
The September 15–16 Federal Reserve meeting is the next scheduled test for the US Dollar and interest-rate backdrop. Before then, silver faces a more immediate test at its 200-day average near $72.36.
A sustained break above that level would show the recovery can extend without waiting for another policy catalyst. Until silver can hold above $72.36, the move remains a powerful rebound rather than a convincing challenge to its 2026 peak.