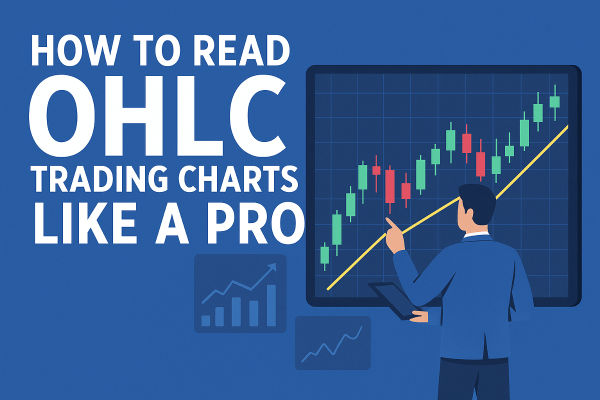
Markets breathe in four beats: open, high, low, and close. Each of these points tells part of a story that traders have been reading for more than a century. While modern algorithms execute thousands of orders in milliseconds, every one of them still relies on those four data points to define what a market truly did.
OHLC trading condenses market chaos into structure. (OHLC stands for Open, High, Low, Close, four core prices summarizing each period of trading.) Whether it is a central bank announcement, a corporate earnings release, or a geopolitical shock, each day ends with a single bar that summarises the entire struggle between buyers and sellers.
According to the Bank for International Settlements’ April 2025 triennial survey, the forex market now turns over about USD 7.5 trillion a day, making it the largest and most liquid financial marketplace on earth. Nearly all of that liquidity is visualised using OHLC charts.
Reading these bars is not just about numbers. It is about sentiment, exhaustion, conviction, and control. Learning to interpret them separates those who merely watch prices from those who truly understand price behaviour.

What Is OHLC Trading?
OHLC stands for Open, High, Low, and Close, the four essential prices that define any trading session.
Open: The price at which the trading period began.
High: The maximum price reached.
Low: The minimum price reached.
Close: The final price when the session ended.
Every chart, from one-minute intervals to monthly candles, is built on this same foundation. These four points record how much the market moved, how far volatility stretched, and which side of the trade controlled the outcome.
For example, the EUR/USD daily bar from 12 September 2025 opened at 1.1058, climbed to 1.1104, dipped to 1.1010, and closed at 1.1089. Although the range was modest, the long lower wick showed that buyers absorbed intraday selling pressure, setting the tone for a continuation rally.
OHLC charts compress thousands of individual trades into four meaningful data points, giving traders a structured lens through which to analyse market dynamics. This underlying structure paves the way for understanding the unique role of each OHLC component.
The Four Building Blocks of OHLC Charts
Open: The Market’s First Breath
The opening price marks the first trade of the session, often influenced by overnight sentiment. A large gap between yesterday’s close and today’s open suggests that new information has shifted expectations.
For instance, when Japan’s Nikkei 225 futures opened 1.3 per cent lower on 1 April 2025, it was not random. US semiconductor earnings released after the Tokyo close had disappointed, forcing traders to adjust positions at the next available open.
The open therefore sets the tone. A gap up suggests optimism, while a gap down hints at risk aversion.
High: The Test of Resistance
The high is the point where enthusiasm meets exhaustion. When gold (XAU/USD) touched USD 2,487 per ounce on 5 August 2025, it reflected a rush into safe-haven assets after weaker US labour data. But sellers emerged swiftly, rejecting that level and pulling prices USD 40 lower.
Highs highlight where major supply or profit-taking begins. When several consecutive bars fail to exceed a previous high, resistance is confirmed.
Low: The Anchor of Demand
The low captures the point of maximum pessimism. In July 2025, when GBP/USD bottomed at 1.2445 following dovish Bank of England signals, the market found solid buying interest. The subsequent bounce confirmed that institutions were accumulating, not dumping.
For technical traders, identifying the relationship between current and prior lows is essential. A higher low signals strength, while a lower low often confirms weakness.
Close: The Decisive Verdict
The close is where institutional money declares its position. Portfolio valuations, risk metrics, and fund performance are calculated on closing prices.
When the NASDAQ 100 closed above 19,000 on 16 May 2025, it officially confirmed a bullish breakout that had been building for weeks. The bar closed near its high, showing conviction rather than hesitation.
Strong closes near highs imply control by buyers, while weak closes near lows suggest persistent selling pressure.
Why OHLC Trading Still Matters in 2025
Despite complex tools like Heikin-Ashi, Renko, and tick charts, OHLC remains the backbone of global price discovery.
A 2025 Refinitiv survey revealed that 82 per cent of institutional trading algorithms still use OHLC-based indicators such as range expansions, moving averages, and volatility clusters. Even machine learning models trained for high-frequency trading rely on OHLC values to define candle geometry.
Regulators also mandate OHLC publication for transparency. Under FCA and ASIC frameworks, brokers like EBC provide time-stamped OHLC data to ensure that traders worldwide reference identical price structures.
For example, during the US CPI announcement on 13 June 2025, EUR/USD’s range widened by over 220 per cent above its 20-day average, captured perfectly through OHLC values. Those who recognised the expansion early positioned for breakout trades before most indicators reacted.
How to Read an OHLC Chart Like a Pro
Reading OHLC bars is both art and science. Each bar is a microcosm of trader behaviour.
Follow this process:
Compare open and close: A close above the open indicates buying pressure; below means selling strength.
Assess range: Wide bars reflect volatility and decisive conviction.
Observe cluster sequences: Three consecutive higher closes typically confirm momentum continuation.
Combine context: Align highs and lows with previous zones to confirm support or resistance.
Example: Between 10–14 March 2025, EUR/USD printed three higher closes from 1.0840 to 1.0940. This cluster preceded a sustained breakout above 1.10, validating the predictive power of OHLC pattern sequences.
OHLC vs Candlestick Charts
Both chart types represent the same data, but their readability differs.
Candlesticks fill the space between open and close, showing bullish or bearish bias through colour. OHLC bars, however, use left and right ticks to denote open and close levels, giving a cleaner, quantitative view.
A 2025 CME Group survey found that 70 per cent of professional quant teams prefer OHLC formats for back-testing because they eliminate colour interpretation bias. Human traders, however, often combine both: candlesticks for clarity, OHLC for precision.
Analysing Market Sentiment Through OHLC Bars
Professional traders calculate the bar strength ratio to measure control:
(Close − Open)÷(High − Low)\text{(Close − Open)} ÷ \text{(High − Low)}(Close − Open)÷(High − Low)
Ratios above +0.6 show strong buying; below −0.6 indicate aggressive selling.
During the Fed meeting on 18 September 2025, USD/JPY showed a ratio of −0.82, signalling heavy dollar selling. The pair fell 250 pips in two days.
OHLC bars also reveal subtle momentum changes. Long upper wicks show failed rallies. Long lower wicks show failed sell-offs. A narrow bar after a volatile run often signals fatigue or balance.
Volume confirmation matters too. In June 2025, oil futures saw a series of wide OHLC bars on heavy volume ahead of OPEC’s decision to maintain output. This combination confirmed genuine institutional participation, not random volatility.
Intraday OHLC Dynamics
OHLC principles apply across all timeframes. On intraday charts, they reveal the rhythm between session overlaps.
For instance, the London–New York overlap (1–4 p.m. GMT) produces the day’s largest OHLC ranges in forex markets. The EBC 2025 trading volume dataset showed that over 60 per cent of intraday range expansion in EUR/USD occurred during these hours, highlighting where professional liquidity concentrates.
Short-term traders use the first hourly bar’s OHLC to gauge direction. If the subsequent hour breaks above that high, the bias turns bullish; below the low, bearish. This approach is particularly effective during high-impact news sessions like CPI or FOMC announcements.
Advanced OHLC Trading Strategies
Breakout Confirmation via Range Expansion
When OHLC bars widen beyond average range, volatility is expanding. In April 2025, NASDAQ futures extended their daily range by 40 per cent before breaking resistance at 18,600. Traders who tracked range expansion anticipated the surge before it hit headlines.
Multi-Timeframe Confluence
Alignment across charts adds confidence. A bullish daily OHLC bar supported by a four-hour higher low on gold produced a 2.5:1 risk-reward trade in May 2025, with price gaining USD 80 per ounce in one week.
Volatility Compression
When OHLC bars narrow consecutively, pressure builds. The CME’s 2025 statistics showed that tight three-day compressions lead to outsized moves within five sessions 63 per cent of the time.
OHLC and RSI Integration
When closing prices stay above the 20-day EMA while RSI holds near 60, the combination signals trend persistence. This hybrid method turns static OHLC data into actionable momentum insight.
Case Studies: OHLC Trading in Action (2024–2025)
Forex Example – EUR/USD Spring 2025
From March to April, EUR/USD advanced from 1.0830 to 1.0950 as three consecutive bullish OHLC bars formed. Each bar’s close exceeded the prior high, forecasting a breakout above 1.10, which soon followed.
Commodity Example – Gold, Autumn 2024
Between June and August 2024, gold fluctuated under USD 2,350 with progressively narrowing OHLC ranges. When September opened with a decisive wide-range bar and strong close, gold surged USD 120 within ten days.
Equity Example – Nvidia and SMH ETF, Mid-2025
In July 2025, SMH ETF’s OHLC range widened from 4 to 6 per cent before Nvidia’s earnings. The data hinted at accumulation. Nvidia’s results later beat revenue expectations by 8 per cent, pushing SMH to record highs.
Oil Example – Brent Crude, October 2025
Brent crude printed three lower highs and a close below USD 64 after OPEC projected higher inventories. The consistent lower closes across OHLC bars warned of trend exhaustion weeks before prices slid to USD 59.
Common OHLC Trading Mistakes
Trading single bars in isolation instead of clusters.
Ignoring session timing; liquidity differs by region.
Focusing on tiny intervals without higher timeframe context.
Confusing algorithmic spikes for genuine volume.
Skipping stop-loss placement even when bars align perfectly.
Psychological Edge in OHLC Trading
OHLC bars expose crowd psychology. The open reflects expectation, the high captures euphoria, the low measures fear, and the close decides consensus.
When traders learn to read these shifts, they see markets differently. A narrow bar after an extended rally means confidence is fading. A series of closes near the top of the range shows conviction.
Behavioural finance studies in 2025 from Oxford University found that traders using structured OHLC analysis demonstrated 23 per cent higher risk-adjusted returns compared to those relying solely on moving averages. This proves that pattern literacy leads to emotional discipline.

The Future of OHLC Analytics
In 2025, AI-driven systems process over 50 million OHLC bars daily to identify probabilistic setups. Machine learning models detect patterns invisible to the human eye, such as “triple inside bars” or “fractal expansions.”
Yet human judgement remains vital. In July 2025, algorithms flagged USD/CHF as a long candidate based on OHLC compression. Human traders vetoed the signal after rumours of Swiss National Bank intervention. The market indeed reversed, validating discretion over automation.
This synergy between algorithmic precision and human context will define OHLC trading through 2026 and beyond.
FAQs About OHLC Trading
Q1. What does OHLC mean?
It stands for Open, High, Low, and Close, the four prices defining each trading period. Every chart, from forex to commodities, builds from these values.
Q2. Why do traders rely on OHLC trading?
Because it distils thousands of trades into a clear representation of market control. OHLC analysis helps identify who dominated a session, how far volatility stretched, and when momentum shifted.
Q3. Does OHLC trading still work in today’s AI-driven markets?
Yes. Even the most advanced algorithms depend on OHLC data for signal generation. The format’s simplicity, accuracy, and universality make it timeless.
Conclusion
Reading OHLC charts is both science and art. Every bar reveals where the battle began, how far it stretched, how deep it fell, and where it finally settled. Those who can interpret that rhythm gain an enduring advantage.
Even in the age of algorithmic execution, OHLC trading remains the universal language of price action. Whether analysing forex, equities, or commodities, these four points remain the heartbeat of market structure. Learn to read them, and you will not just observe the market, you will understand it.
Disclaimer: This material is for general information purposes only and is not intended as (and should not be considered to be) financial, investment or other advice on which reliance should be placed. No opinion given in the material constitutes a recommendation by EBC or the author that any particular investment, security, transaction or investment strategy is suitable for any specific person.
