Published on: 2025-12-15
Updated on: 2025-12-15
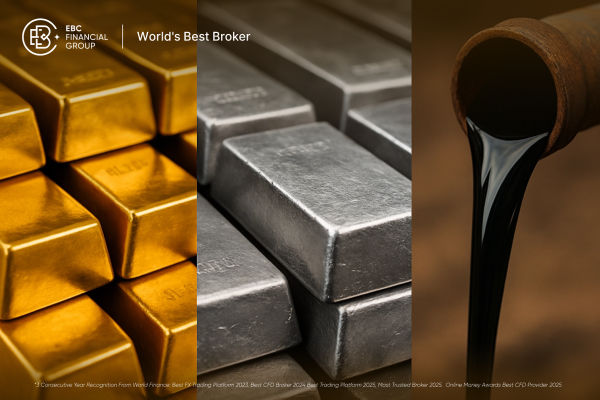
Silver is having the kind of year traders talk about for a decade. The white metal has smashed through every historical ceiling, printing fresh all-time highs above $64 an ounce and more than doubling in 2025.
Gold has closely followed with record highs above $4,300, while Brent crude languishes around $61 per barrel, on track for one of its worst years since 2020.
This article walks through where prices are today, what is driving the move in gold, silver and crude oil, and which technical levels matter most if you are planning trades into the end of the year and through 2026.
| Asset | Latest price (approx.)* | 1-month move | 12-month context | Key takeaway |
|---|---|---|---|---|
| Gold (spot) | $4,320/oz | Slightly higher | Near record high after a 50–60% rally this year | Safe-haven and rate-cut driven uptrend is intact. |
| Silver (spot) | Above $62/oz | Strongly higher | Up roughly 95–130% this year depending on market and currency | Precious metal with both monetary and industrial tailwinds is outperforming gold. |
| Brent crude | $61.4/bbl | Down about 4–5% | Down roughly 17% year-on-year | Oversupply concerns and cautious demand forecasts weigh on prices. |
| WTI crude | $57.7/bbl | Down about 3–4% | Down almost 18% year-on-year | Market trades in a soft downtrend despite periodic geopolitical spikes. |
*Prices rounded; all references are to mid-December 2025 data.
Across the main global benchmarks, you can see a clear divergence.
Silver is trading around $62 per ounce, up more than 100% year to date, after setting a new all-time high near $64.60 in mid-December.
Gold is sitting near $4,300 per ounce, within one to two per cent of its record high around $4,381 from October.
Brent crude is around $61–61.5 per barrel, down roughly 17% versus a year ago and locked in a broad downtrend.
The macro glue is familiar: the Federal Reserve has delivered a series of cuts in 2025, the dollar has softened, and real yields have rolled over.
The International Energy Agency, ING and the US Energy Information Administration now describe the situation as a "great divergence", with metals surging and energy markets weighed down by rising inventories and modest demand growth.

Silver has transitioned from "catch-up trade" to front-of-book macro story. Current data show spot silver around $62 per ounce, up over 100% in 2025 alone.
The metal has set a string of records:
All-time high at $64.60 on 12 December.
Intraday peaks around $64.3–64.6 after the Fed's latest 25-basis-point cut.
First break above $60 per ounce, with prices more than doubling since January.
India's MCX futures have echoed the squeeze, pushing past ₹2 lakh per kilogram for March delivery and reinforcing the global picture of a runaway silver tape.
Silver is benefiting from both monetary and industrial themes:
On the monetary side, it tends to move with gold when rate expectations fall, and the dollar weakens.
On the industrial side, demand for silver in solar panels, electronics and green technologies has risen strongly. At the same time, supply growth has been constrained by under-investment in new mines in the previous decade.
Silver also entered the year from a much cheaper base relative to gold, so part of the outperformance reflects a catch-up phase after years of underperformance.
The main risk now is that speculative positioning becomes too crowded.
As silver has pushed through successive psychological levels, retail interest and leverage have increased, particularly through ETFs and short-dated options.
Silver is far more volatile than gold, so 10–15% pullbacks can unfold within days, even in a strong bull market.
From a trading perspective, silver should be viewed as a high-beta expression of the same macro drivers that move gold, with an added industrial demand component and sharper swings in both directions.

Gold has been dragged higher by the same macro currents, even if silver has stolen the headlines.
Spot gold is trading around $4,300 per ounce.
The metal set an all-time high near $4,381 in October and has repeatedly probed above $4,300 after the Fed's December cut.
The Bank for International Settlements estimates that gold is up about 60% year to date, alongside double-digit gains in US equities.
The BIS went as far as to say that both gold and US stocks now show "bubble-like" features, driven heavily by retail flows and media hype.
Gold's support pillars look familiar if you have traded any of the post-2008 easing cycles.
The Fed has cut rates several times in 2025, and markets expect at least one more move in 2026, even after a hawkish dot plot.
Central banks have been persistent net buyers of gold, as highlighted in the World Gold Council's research and mid-year outlook.
Geopolitical risk has remained elevated from Eastern Europe to the Middle East, providing gold with a persistent safe-haven bid.
On top of that, the same factors that support silver–dollar weakness, falling real yields, and a hunt for assets outside the banking system flow directly into the gold tape.

Against that metal backdrop, oil has been the laggard.
WTI crude trades around $57–58 per barrel, down nearly 18% over the past year.
Brent crude trades near $61–62 per barrel, down almost 17% over 12 months and 4–5% in the past month.
Futures curves for both benchmarks are relatively flat to slightly contangoed as inventories build and traders expect modest oversupply into 2026.
It is not a collapse scenario, but it is clearly a soft market rather than a tight one.
The fundamental backdrop explains why oil is falling while metals rise.
The International Energy Agency expects global oil demand to rise by only 830,000 barrels per day in 2025 and by around 860,000 barrels per day in 2026, which is a modest pace compared with previous cycles.
Global supply is rising from non-OPEC production and the gradual unwinding of voluntary OPEC+ cuts, leading to higher inventories through 2025 and into 2026.
A recent OPEC report indicated that the organisation now expects the oil market to be broadly balanced by 2026, rather than in deficit, which triggered a sharp one-day drop of more than $2 per barrel in both Brent and WTI in November.
The EIA now forecasts Brent crude averaging $55 per barrel in 2026, with rising inventories and oversupply capping prices.
Geopolitical tension remains a permanent background risk, but positioning data and bank research both show that professional traders are more focused on supply-demand fundamentals than on headline risk at the moment.
Below is a structured technical overview of XAU/USD (gold), XAG/USD (silver), and WTI crude oil, based on spot and front-month futures levels around mid-December 2025.
| Asset and timeframe | Trend bias | Key support levels (approximate) | Key resistance levels (approximate) |
|---|---|---|---|
| Gold (XAU/USD): Daily | Bullish | $4,220–4,250 (recent breakout area); then $4,100; deeper support near $3,950 | $4,350–4,380 (record-high band); then $4,450 as a measured extension |
| Gold (XAU/USD): 4-hour | Uptrend with frequent shakeouts | $4,250; then $4,200 intraday | $4,320–4,340; then $4,380 |
| Silver (XAG/USD): Daily | Strongly bullish, over-extended | $58–59 (recent breakout zone); then $55–56; deeper support near $50 | $62–64 (recent spike area); then a psychological line at $70 |
| Silver (XAG/USD): 4-hour | High-beta uptrend | $59 intraday; then $57–58 | $62–63 |
| WTI crude: Daily | Gentle downtrend | $56–57 (recent lows); then $54–55 (projected 2026 average area) | $60–61 (recent resistance); then $64–65 (prior swing highs) |
| WTI crude: 4-hour | Range-bound within a down-channel | $57; then $56 | $59–60 |
These levels are not rigid lines, but they give a useful framework for planning entries, exits and risk around key macro events such as the US jobs report and upcoming central bank speeches.
Yes. Silver set a new all-time high in mid-December at around $64.6 per ounce.
Silver has outperformed gold by sharing the same monetary tailwinds and benefiting from robust industrial demand in solar, electronics, and green technologies amid relatively constrained mine supply.
Gold is trading near $4,300 per ounce, only a small distance from its record of around $4,381 set in October 2025.
Yes. Brent is down around 17% year on year, trades well below its early-2020s highs.
In conclusion, the current commodity market is defined by a clear split. Gold and silver are shining, supported by rate cuts, a softer dollar, and continued demand for insurance assets in an uncertain macro and geopolitical environment.
Oil is struggling, weighed down by rising inventories, modest demand growth and increasingly cautious forward guidance from agencies such as the IEA and the EIA.
For traders and investors, the key is not to chase every spike, but to understand where the structural support really lies.
Disclaimer: This material is for general information purposes only and is not intended as (and should not be considered to be) financial, investment or other advice on which reliance should be placed. No opinion given in the material constitutes a recommendation by EBC or the author that any particular investment, security, transaction or investment strategy is suitable for any specific person.