Published on: 2026-03-05
A fakeout in trading occurs when the price of an asset appears to break through an important technical level, such as support, resistance, or a trendline, but then quickly reverses direction.
In simple terms, a fakeout is a false market signal that leads traders to enter positions prematurely, only for the price to move in the opposite direction shortly afterwards.
Fakeouts are common across financial markets and can occur in stocks, commodities, cryptocurrencies, and forex trading. They are especially noticeable in breakout trading strategies, where traders attempt to enter positions when the price moves beyond key technical levels.
Because many traders monitor the same chart patterns and price levels, temporary moves beyond these levels can trigger orders that create brief but misleading price movements.
Financial markets are influenced by liquidity, trader psychology, algorithmic trading activity, and institutional participation. Fakeouts often occur when the price briefly moves beyond a widely watched level but lacks the momentum required to sustain the breakout.
Several factors commonly contribute to fakeouts.
Sometimes, a price move beyond a support or resistance level attracts initial attention but does not generate sufficient buying or selling pressure to maintain the breakout.
Without sustained participation from traders and institutions, the move can quickly lose strength and reverse.
Traders who entered positions earlier in a trend may decide to close their trades once the price approaches a key level. This wave of profit-taking can create opposing pressure that pushes the market back in the opposite direction.
As a result, the breakout fails to continue.
Many traders place stop-loss orders near important technical levels. When the price briefly crosses these areas, stop orders can be triggered simultaneously.
This sudden burst of order activity can create a short-lived price spike that quickly fades once those orders are filled.
Large institutional participants sometimes push prices beyond obvious support or resistance levels to trigger stop-loss orders and capture available liquidity.
Once sufficient liquidity enters the market, the price may reverse direction. This dynamic can create the appearance of a breakout that ultimately becomes a fakeout.
Fakeouts often occur near technical levels where many traders are watching for breakout opportunities. Common locations include:
Support levels
Resistance levels
Trendlines
Chart pattern boundaries
Breakout zones
These areas tend to concentrate large numbers of pending orders, including stop losses and breakout entries. As a result, they become highly contested zones where sudden price reactions frequently occur.
Because traders across the market often rely on similar technical analysis tools, these levels naturally attract attention and trading activity.
Consider a stock that has repeatedly failed to move above $100, creating a strong resistance level. Many traders believe that if the price moves above this level, a new upward trend could begin.
The sequence might unfold like this:
Price approaches $100 and briefly rises to $101.
Traders interpret the move as a breakout and begin entering long positions.
Instead of continuing higher, the price quickly falls back below $100.
Selling pressure increases, pushing the price down to $97 or $95.
In this case, the move above $100 was a fake breakout, or fakeout. Traders who entered positions expecting a sustained rally may be forced to exit their trades at a loss.

Distinguishing between a fakeout and a genuine breakout is one of the most challenging aspects of technical trading.
Although traders attempt to identify genuine breakouts, no method guarantees accuracy. Markets frequently produce false signals, especially during periods of high volatility or low liquidity.
Although fakeouts are unavoidable in financial markets, traders often use several techniques to reduce the risk of acting on false signals.
Instead of entering a trade immediately when the price crosses a level, some traders wait for a price candle to close above or below that level. This approach helps confirm whether the breakout is sustained rather than temporary.
Breakouts accompanied by strong trading volume may indicate broader market participation and stronger conviction. Conversely, breakouts with low volume may signal a higher probability of failure.
Some traders wait for the price to break a level and then return to test it again. If the previous resistance becomes support, or previous support becomes resistance, it can provide stronger confirmation that the breakout is genuine.
Major economic announcements, earnings releases, or geopolitical events can trigger sudden volatility. These periods often produce rapid price spikes that may quickly reverse, increasing the likelihood of fakeouts.
Even with these precautions, fakeouts remain a natural and unavoidable part of market behaviour.
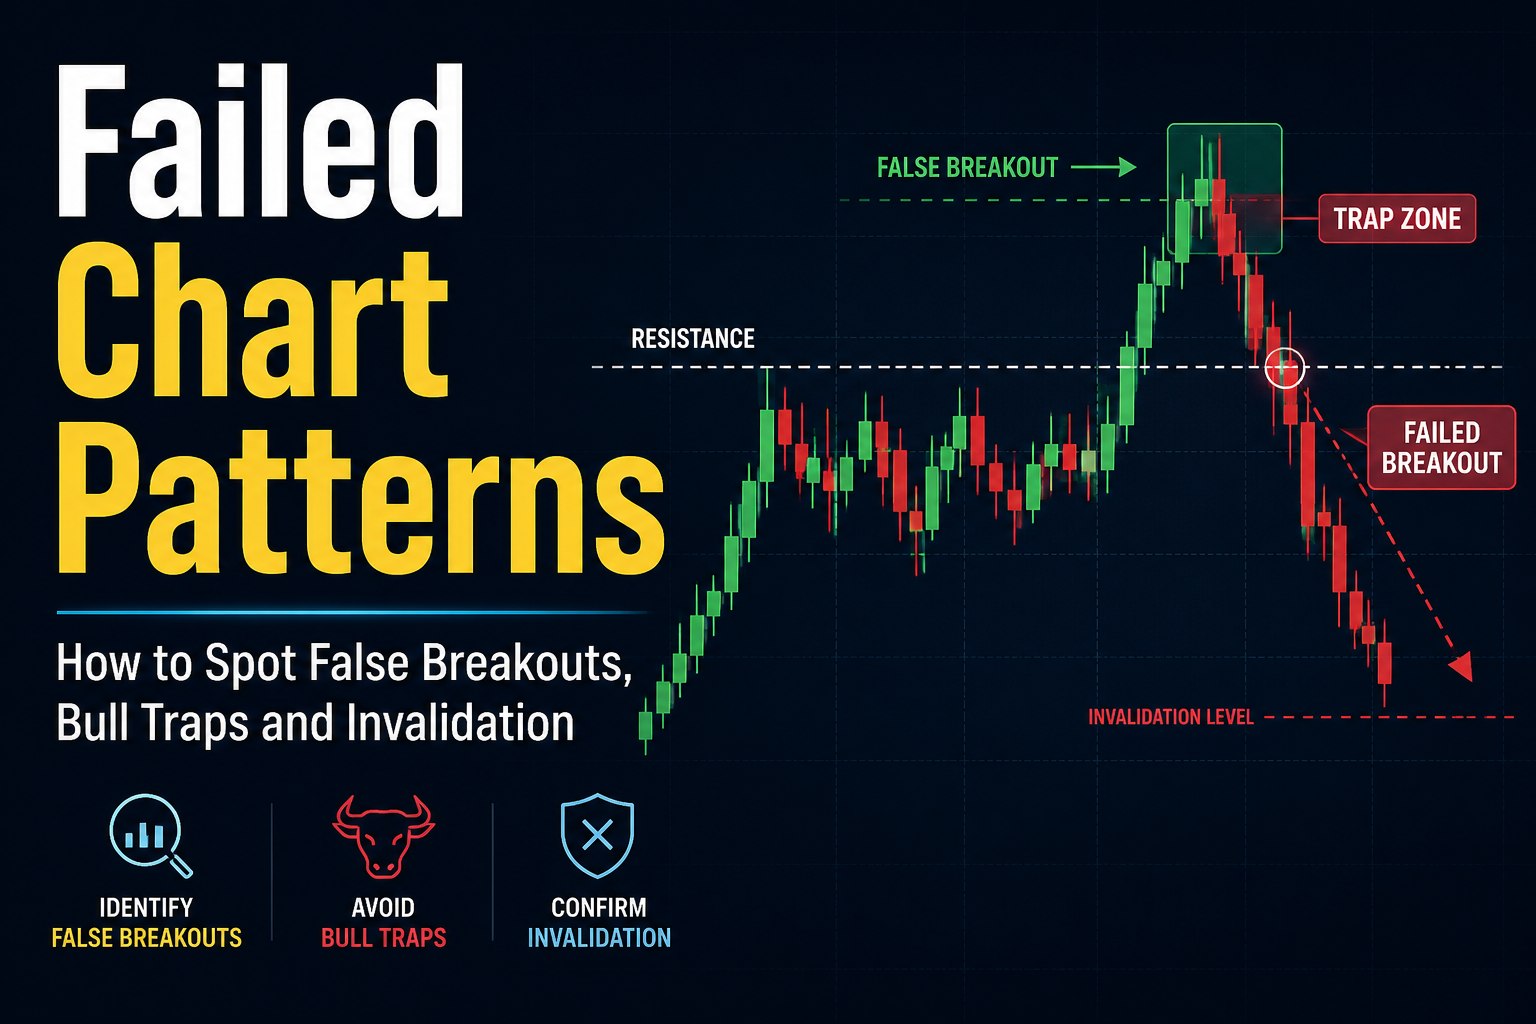
False Breakout: A price movement that temporarily breaks support or resistance before quickly reversing direction.
Whipsaw: A rapid market movement followed by an immediate reversal that can trigger losses for traders on both sides of the market.
Bull Trap: A situation where the price moves above resistance, attracting buyers before reversing downward.
Bear Trap: A situation where the price falls below support, attracting sellers before reversing upward.
Support and Resistance: Price levels where buying or selling pressure tends to emerge and influence market direction.
A fakeout occurs when the price appears to break through an important level, such as support or resistance, but then quickly reverses. This creates a false trading signal that may trap traders who enter positions expecting a sustained breakout.
Fakeouts can occur due to factors such as weak momentum, stop-loss triggers, profit-taking, or institutional trading activity. When price briefly moves beyond a key level without strong market participation, the breakout may fail and reverse.
Fakeouts and false breakouts describe very similar situations. Both refer to price movements that temporarily move beyond a technical level before reversing. In many trading discussions, the terms are used interchangeably.
Traders often attempt to reduce fakeout risk by waiting for candle close confirmation, analysing trading volume, watching for retests of breakout levels, and avoiding trades during highly volatile news events.
Yes. Fakeouts occur across many markets, including stocks, commodities, cryptocurrencies, and foreign exchange. They are particularly common around widely watched technical levels where many traders place orders.
A fakeout is a temporary price movement that appears to signal a breakout but then quickly reverses. These misleading signals commonly occur around major technical levels such as support and resistance, where large numbers of traders place orders.
Because fakeouts can trap traders who act too quickly on breakout signals, many market participants rely on confirmation techniques, such as volume analysis, candlestick patterns, and level retests, before entering trades.
While fakeouts cannot be completely avoided, understanding how and why they occur can help traders interpret market movements more carefully and improve their overall trading discipline.
Disclaimer: This material is for general information purposes only and is not intended as (and should not be considered to be) financial, investment or other advice on which reliance should be placed. No opinion given in the material constitutes a recommendation by EBC or the author that any particular investment, security, transaction or investment strategy is suitable for any specific person.


World's Best Broker