Published on: 2026-06-08
Global remittances reached $905 billion in 2024, up 4.6% from $865 billion the year before, with $685 billion of that going to low- and middle-income countries. That sum is larger than the combined total of foreign direct investment and official development assistance. Over the past decade, remittances grew by 57%, while FDI to developing economies fell by 41%.
Mexico received $61.79 billion in 2025, a 4.6% drop from the 2024 record of $64.75 billion. The fall ended an 11-year growth streak and marked the first annual decline since 2020. Close to 160,000 deportations in 2025, more than 90% of the Mexican cases were long-term residents and active senders, driving the contraction.
A 1% federal excise tax on cash-funded transfers took effect on January 1, 2026 under the One Big Beautiful Bill. It exempts bank and card transfers, splitting the market into one tier for the banked and another for everyone else. At a global average sending cost of 6.36%, the formal system already pulls roughly $57 billion a year from these flows in fees.
Senders raised the average amount remitted by about 25% in 2025 ahead of feared removal, lifting flows to much of Latin America by more than 16%. That behavior front-loads transfers rather than growing them. Rising formal costs are pushing volume toward hawala networks and dollar-stablecoins that balance-of-payments accounting cannot capture.
Mexico received $14.45 billion in remittances in the first quarter of 2026, a 1.4% rise that local banks called the strongest opening quarter since 2023. It landed three months after the country posted its first annual remittance decline in more than a decade.
Globally, the picture looks steadier still. Remittances reached $905 billion in 2024, and $685 billion of that went to developing countries, a sum larger than foreign direct investment and official development assistance put together. The calm in those numbers hides a system that is being quietly rerouted off the rails that measure it.
Over the past decade, remittances to low- and middle-income countries grew 57%, while foreign direct investment to those same economies fell 41%. By 2024, the annual remittance total reached $685 billion. Remittances had already overtaken FDI to developing countries by more than $250 billion in 2023, a gap the World Bank expects to keep widening.

The flow earned that lead by doing what no other external source of finance reliably does. When global income contracted by 3% in 2020, global FDI fell by about 42%, while remittances dropped by only about 1% and recovered within a year. The same resilience held in 2008, when private capital fled developing markets and migrant transfers continued to arrive.
The mechanism behind it is behavioral. Migrants cut their own spending before they reduce what they send home, and they send more when the home economy weakens. The United Nations and the World Bank both rank remittances as the least volatile major external flow to developing economies, a countercyclical property that no sovereign bond or aid program reliably shares.
India remained the largest recipient in 2024 at $129 billion, a position it has held since 2008. Mexico followed at $68 billion, with the Philippines at $40 billion and Pakistan at $33 billion among the next largest. In absolute terms, the flow concentrates in big economies, yet its weight falls heaviest on small ones.
Remittances equal about 45% of GDP in Tajikistan, the most dependent economy on earth, followed by Tonga at 38%, Nicaragua and Lebanon at around 27%, and Samoa at around 26%. The global average sits below 1%. In Guatemala, where remittances account for nearly 19% of GDP, a 5% drop in inflows would erase nearly a full percentage point of output growth, a loss no central bank can offset on its own.
Africa shows the development of math most plainly. In recent years, the continent has received around $90 billion a year in remittances, more than its net FDI and aid inflows, each of which is near $60 billion.
Those inflows steady current accounts and foreign reserves, and they feed into the sovereign creditworthiness that sets what African governments pay to borrow, the same pricing gap examined in EBC’s analysis of the 9% versus 4.7% borrowing gap facing Africa.
For the first time since this system reached scale, three separate policy forces are pressing on it at once. None was built with the others in mind. Together, they pull in the same direction, and no one has connected them into a single chain.
Close to 160,000 people were deported from the United States in 2025, and more than 90% of the Mexican cases were long-term residents who had lived in the country for over four years.
These were established earners with years of steady sending behind them. Their removal, combined with at least 200,000 fewer new migrants and a fall of roughly 500,000 in the sender population, erased an estimated $3 billion in transfers.
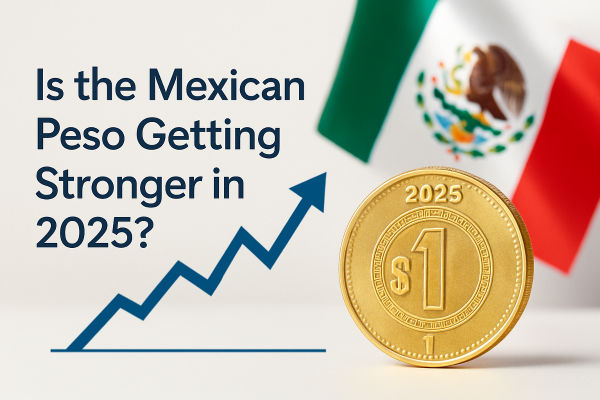
Mexico absorbed the largest single blow. Family remittances fell to $61.79 billion in 2025, down 4.6% from the 2024 record of $64.75 billion, the steepest annual decline in 16 years and the first since 2020.
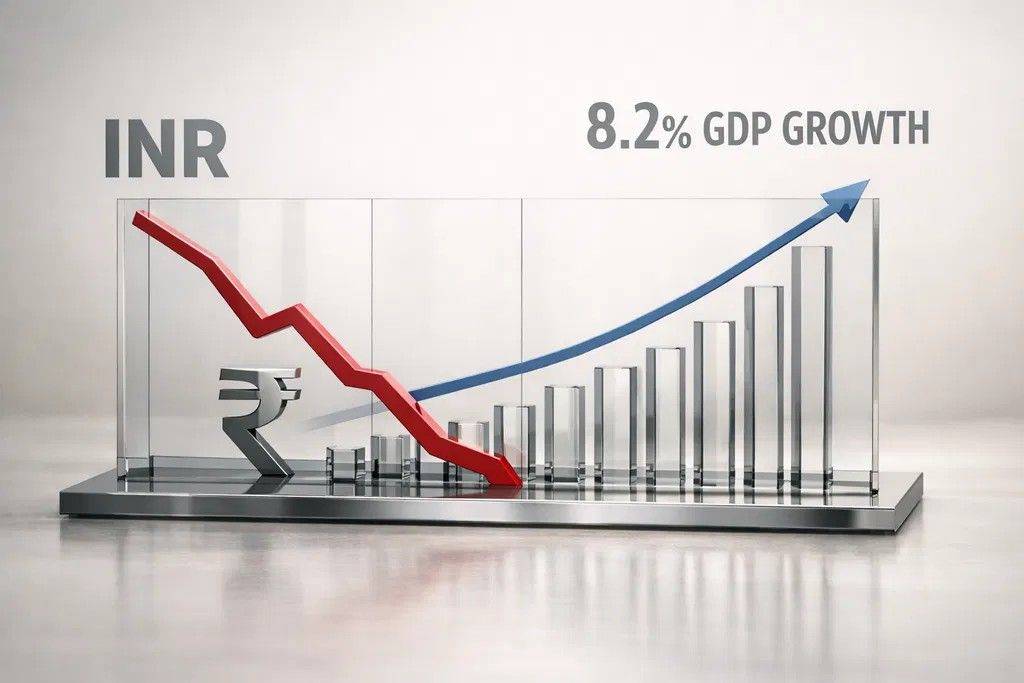
A peso that strengthened about 10% against the dollar, together with domestic inflation, cut the real purchasing power of those inflows about 14% for receiving households.
A 1% federal excise tax on remittances took effect on January 1, 2026, written into the One Big Beautiful Bill signed the previous July. It applies only to transfers funded with cash, money orders, or cashier’s checks, the instruments used most by low-income and undocumented senders. Transfers from bank accounts and US debit or credit cards are exempt.
The design splits the market into two. Senders with bank access pay nothing, while those without it pay on every dollar, which lands hardest on the people the system was built to serve. The rate started at 5% in early drafts and settled at 1%, with the Joint Committee on Taxation projecting about $10 billion in revenue over ten years.
The cost of moving the money predates both other forces and dwarfs the new tax. Sending remittances costs a global average of 6.36% in the third quarter of 2025, more than double the 3% target governments set for 2030. Banks remain the most expensive channel, and sub-Saharan Africa the most expensive destination, at 8.78%, compared with 5.18% for South Asia.
At that average rate, the formal system extracts nearly $57 billion per year from $905 billion in flows. That is more than any country receives in remittances except India and Mexico. The 3% goal will go unmet, with corridors still lacking low-cost options, particularly in Africa.
A cooling US labor market is doing damage of its own, separate from any deportation. BBVA notes that conditions have turned unfavorable for the sectors that employ most Mexican migrant labor, including construction, hospitality, and light manufacturing.
Fewer hours and softer wages in those industries shrink the surplus that becomes a transfer, well before any enforcement action removes a single worker.
That squeeze compounds the demographic shift already underway. New migration into the United States has slowed sharply since 2024, and remittance growth has historically tracked the arrival of new senders rather than higher payments from existing ones.
With the inflow of new workers thinning and the existing pool earning less, the engine that produced 11 straight years of Mexican growth has lost its two main drivers at the same time.
The most misread number in 2025 was a jump in the average transfer size. Across Latin America outside Mexico, senders raised the typical amount remitted by about 25%, lifting full-year flows to Honduras by 25%, Guatemala by 19%, and El Salvador by 18%.
The surge reflected fear of removal rather than rising prosperity. Senders facing possible deportation moved as much money home as they could while they still earned in dollars, a precaution analysts expect to fade in 2026 because the higher amounts already exceed what most can sustain. Front-loading transfers ahead of a forced exit is a signature of a system under stress, closer to a slow bank run than to growth.
The split between Mexico and its neighbors confirms the reading. Mexican migrants had already been sending near the ceiling of their incomes for years, so they could not front-load further, which is why Mexico fell while the rest of the region surged.
Mexico’s first-quarter rebound in 2026 fits the same logic, with BBVA still projecting full-year inflows near $60 billion, below the 2024 record, as the early strength looks like the tail of 2025’s front-loading working through the data.
As formal costs climb, volume is migrating to channels that official statistics never capture. Senders from Nigeria, India, and across Latin America move money through hawala networks, trusted couriers, and peer-to-peer transfers that sit outside regulated rails.
A May 2025 Bank for International Settlements working paper found that higher traditional remittance costs are strongly associated with larger cross-border stablecoin and low-value bitcoin flows into developing economies, and that capital flow controls do little to stop them.
The crypto channel has moved from theory toward infrastructure. Total stablecoin supply roughly doubled from about $150 billion to $305 billion between mid-2024 and October 2025 before leveling off, with remittances accounting for an estimated 15% of usage.
Dollar tokens now settle hundreds of billions in cross-border value a year, and a share of that is the same household support that once ran through licensed operators.
The policy outcome runs against its own intent. A 1% tax meant to raise revenue pushes cash senders toward hawala, which carries the anti-money-laundering and terrorism-financing risk that regulators spent two decades trying to close.
The $905 billion headline measures only the formal rails, so as those rails lose volume, the official figure will increasingly understate a flow that keeps moving in the dark.
Most forecasts now point to weak formal growth in 2026, likely under 1%, with the direction set less by migration than by how senders respond to costs, enforcement, and the value of the dollars they still earn. The most resilient development finance system of the past half century was never designed, funded, or announced by any institution, and it is now being reshaped by three policies built for unrelated purposes.
The economies most exposed to that reshaping are the ones with the least capacity to absorb the loss, from Tajikistan and Tonga to the Central American states that live on a quarter of their output in transfers. For investors weighing sovereign risk in these markets, the $905 billion headline figure no longer matters. The number to track is the share of it that quietly leaves the channels anyone can measure.