Published on: 2026-08-20
Updated on: 2026-08-20
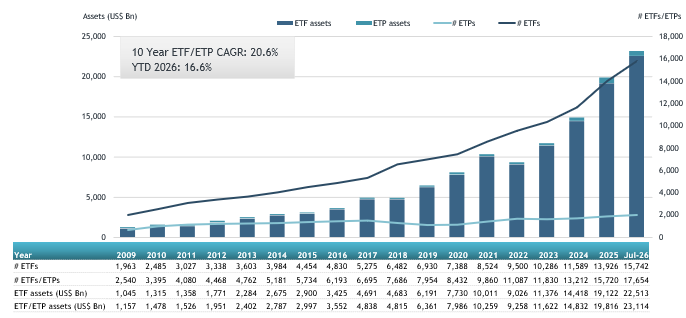
Global ETF assets reached $23.11 trillion after a record $383.6 billion entered in July, yet the small monthly rise in AUM shows how strongly market performance can offset fresh subscriptions.
Fixed-income ETFs have attracted capital well above their share of existing ETF assets, putting bond allocation at the centre of 2026’s record flow story.
TLT gained $5.33 billion while IEF lost almost $4 billion in one week, a shift that more than doubled the duration exposure investors would take by moving from intermediate to long Treasuries.
Active ETFs have gathered $590.46 billion through July, showing that the industry’s growth now includes active portfolio management alongside traditional index exposure.
ETF choice continues to explode, yet the three largest providers still control 58.9% of global assets, leaving industry growth highly concentrated.
Global ETF assets reached a record $23.11 trillion at the end of July after investors poured $383.6 billion into the industry during the month. Year-to-date net inflows climbed to $1.71 trillion, also a record, extending the industry’s run of positive monthly flows to 86 months.

ETF growth now draws from passive equity indexing, fixed-income demand, active strategies and increasingly precise tactical trades, with the recent move into long-duration Treasuries showing how quickly billions can shift when market conviction changes.
Global ETF assets have risen 16.6% from $19.84 trillion at the end of 2025 to $23.11 trillion in July. Net subscriptions over the same period were $1.71 trillion, far below the roughly $3.27 trillion increase in assets under management.
Changes in the value of securities already held, currency effects and other valuation changes account for the difference between fresh subscriptions and total AUM growth, so the two figures need to be read separately.
July made the gap unusually visible. Global ETF assets stood at $23.09 trillion at the end of June. Investors then added a record $383.6 billion in July, yet month-end assets increased by only about $20 billion.
Fresh demand for the ETF structure remained exceptionally strong even as market performance absorbed much of the asset growth those subscriptions would otherwise have produced.
| Metric | Latest Figure | Market Read |
|---|---|---|
| Global ETF assets | $23.11T | Record industry size at end-July |
| YTD net inflows | $1.71T | Highest first-seven-month total on record |
| July net inflows | $383.6B | Record monthly inflow |
| Consecutive inflow months | 86 | Sustained structural demand |
| Equity ETF YTD inflows | $772.88B | Equities remain the largest destination |
| Fixed-income ETF YTD inflows | $314.70B | Bond demand continues to accelerate |
| Active ETF YTD inflows | $590.46B | Active management is a major growth engine |
| TLT weekly flow | +$5.33B | Heavy allocation into long duration |
| IEF weekly flow | −$4.00B | Large retreat from intermediate Treasuries |
Active ETF flows overlap with asset-class totals because “active” describes management style rather than whether a fund holds equities, bonds or other assets. TLT and IEF figures are US-listed weekly flows through August 14.
Equity ETFs still took the largest share of new money, gathering $230.87 billion in July and $772.88 billion through the first seven months of 2026. Fixed-income ETFs added $42.03 billion in July, taking year-to-date inflows to $314.70 billion, up from $216.53 billion over the same period last year. Commodity ETFs received another $3.61 billion during the month.
Bond flows stand out because fixed-income ETFs are attracting capital faster than their existing share of ETF assets would imply. State Street’s US-listed data showed bond ETFs gathering about $300 billion during the first half, equal to 29% of ETF inflows despite fixed income representing only about 16% of ETF assets.
That demand has grown in a bond market where the Federal Reserve is only one part of the pricing equation. Treasury supply, fiscal risk, inflation expectations and term premium have pushed investors to make more deliberate choices about maturity and rate sensitivity.
ETFs allow those views to be implemented at scale, and August produced a particularly sharp example.
During the week ending August 14, the iShares 20+ Year Treasury Bond ETF (TLT) attracted $5.33 billion, equal to roughly 11.7% of its asset base at the time. The iShares 7-10 Year Treasury Bond ETF (IEF) lost almost $4.00 billion, the largest redemption among US-listed ETFs that week.
The split carries more information than the aggregate bond-flow number. TLT’s effective duration was around 14.9 years in mid-August, compared with roughly 6.9 years for IEF, while convexity was about 3.15 versus 0.57.
Moving from IEF-like intermediate-duration exposure toward TLT therefore more than doubled duration sensitivity to changes in yields and created a much larger price response if the long end rallied.
The timing makes the allocation more revealing. Long Treasuries had been under heavy pressure, with the 30-year yield moving above 5.2% and TLT trading near its lowest levels in more than two decades. BlackRock said investors had been using the drawdown to add duration, with the fund attracting billions during the third quarter even as long-end yields remained elevated.
The flows are consistent with investors locking in higher long-term yields, buying after the selloff or positioning for the long end to stabilise. Greater duration also magnifies losses if yields keep rising, so the allocation represents a conscious increase in interest-rate exposure rather than a generic search for safety.
The first-half US ETF flows of 2026 had favoured a very different part of the curve. Long-term government bond ETFs recorded $6.5 billion of net redemptions, while short-term government products attracted $58.2 billion.
One week cannot establish a lasting reversal, though the TLT–IEF split shows how quickly positioning can rotate from capital preservation at the front end toward greater convexity and potential price upside at the long end.
Actively managed ETFs attracted $89.58 billion in July and $590.46 billion through the first seven months of 2026, compared with $322.69 billion over the same period last year.
Those figures should be read separately from the equity and fixed-income totals because active describes how a fund is managed rather than the asset class it owns. An actively managed bond ETF can therefore appear in both the active and fixed-income data.
The size of those flows changes the industry’s growth story. Investors are increasingly choosing the ETF structure while retaining active security selection, asset allocation or risk management.
Intraday tradability, competitive fees and a wider menu of strategies have allowed the wrapper to compete for capital that historically sat in traditional mutual funds or separate accounts. Record ETF growth in 2026 therefore reflects expansion across passive and active implementation.
Product supply is expanding quickly, even as less succesful ETFs are eventually liquidated when they fail to attract sustainable assets or trading demand. ETFGI counted 17,654 ETFs from 1,025 providers across 85 exchanges and 66 countries at the end of July, after more than 2,100 launches during 2026. Capital remains heavily concentrated at the top.
iShares controlled 27.5% of global ETF assets, Vanguard 21.6% and State Street SPDR 9.8%, leaving the three largest providers with 58.9% of industry assets. They also captured about half of year-to-date net inflows.
The 20 largest recipients absorbed $125.96 billion of July’s flows, close to one-third of the month’s total, showing how unevenly the record growth is being distributed across thousands of products.
The next useful signal will come from the composition of flows rather than another AUM milestone. In fixed income, continued TLT inflows alongside IEF redemptions would strengthen the case that duration extension is developing beyond a one-week trade.
Credit ETF flows can reveal whether investors are willing to add spread risk alongside rate risk, while active ETF flows will show whether the migration toward exchange-traded active management continues.
Long Treasury yields remain the immediate test. Additional increases would expose the downside of the duration investors have just added, while a sustained long-end rally would reward the same convexity that made TLT attractive after the selloff.
The $23.11 trillion record captures the ETF industry’s scale. The sharper market signal lies underneath it: billions can now move rapidly between specific pieces of the bond curve, asset classes and management styles. The TLT–IEF divergence captures that change clearly, turning a view on long-term yields into a multi-billion-dollar allocation shift within days.