Published on: 2026-03-31
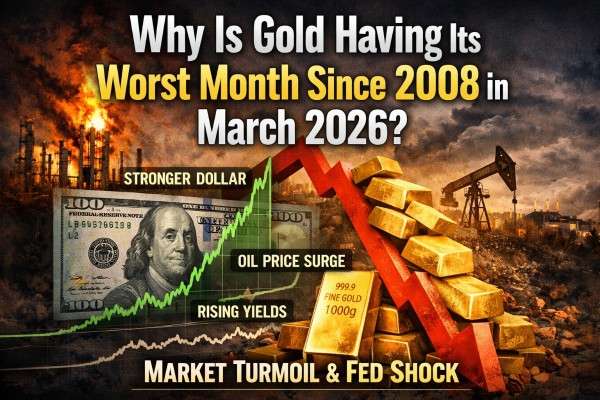
Gold's March 2026 sell-off was not driven solely by a collapse in safe-haven demand. The deeper transmission path was macro. XAU/USD and gold futures declined sharply due to a significant rise in the US dollar, an end-of-month increase in both nominal and real Treasury yields, and a drastic adjustment in Federal Reserve expectations following the Iran-related oil shock.
Gold futures fell 13.54% between March 3 and March 31, putting the metal on track for its worst month since October 2008, even as spot gold stabilized near $4,578-$4,592 into month-end.
In short, the safe-haven premium was overwhelmed by a higher opportunity cost of carry.
| Metric | Latest reading | What it shows |
|---|---|---|
| 1-month move | about 14% | One of the sharpest monthly falls in years |
| Mid-March to March 31 move | about 6% | Selling stayed heavy late in the month |
| Pullback from recent peak near $5,600 | about 18% | The correction has been deep, not minor |
| Earlier 12-month gain before the slump | about +51% | Gold had a lot of profit to give back |

Gold did not fall because geopolitical risk disappeared. It fell because the Iran conflict pushed oil sharply higher, and that changed the market's view of inflation persistence and monetary policy transmission.
Brent's March surge also fed straight into rate expectations. By March 27, markets had fully priced out Fed cuts for 2026 and were assigning a 54% chance of at least one hike by year-end. That was a complete reversal from the easing narrative that had supported gold earlier in the year.
Furthermore, the rate channel did the heavy lifting. The official US 10-year yield rose from 3.97% on February 27 to 4.44% on March 27, while the 10-year real yield climbed from 1.72% to 2.13% over the same period. That is the key macro shock as the market no longer sees gold as a free hedge. It sees a metal competing with a higher real return available in government bonds.
The dollar added a second layer of pressure. The US Dollar Index futures rose from 99.01 on March 3 to 100.31 on March 31, a roughly 2.0% monthly gain. A stronger dollar tightens financial conditions for non-US gold buyers and increases the yield effect. That is why gold fell even during a live geopolitical conflict. The safe-haven premium was not absent. Tighter financial conditions dominated it.

It was not only a fundamental story. It was also a liquidity flush through an over-owned trade. The Wall Street Journal reported that precious metals were hit by investors reassessing rate expectations, taking profits, and raising cash during broader market volatility. COMEX data showed open interest in gold falling to 376,103 on March 30, down 8,520 contracts from the prior session.
There is also an important contrast with strategic demand. The World Gold Council reported that global gold ETFs experienced inflows for the ninth consecutive month in February 2026. Earlier reports indicated that January's inflows had pushed total ETF assets under management and holdings to all-time highs.
WGC's March blog also noted that the PBoC had bought gold for 16 straight months. That means the March collapse looks less like a structural rejection of gold and more like tactical liquidation colliding with a violent macro repricing.
The positioning backdrop mattered because gold entered 2026 extended. WGC reported that total gold demand in 2025 surpassed 5,000 tonnes, and the market experienced 53 all-time highs in gold prices.
By the time March began, the trade was crowded, profitable, and vulnerable. When oil shifted the market from a disinflation narrative to an inflation and rates narrative, gold became a significant source of liquidity.
| Category | Level / Zone | What it means |
|---|---|---|
| Current price | $4,578.52 | Trading above both key moving averages |
| 50-day SMA | $4,501.17 | Near-term trend support |
| 200-day SMA | $4,526.66 | Long-term trend support |
| 52-week range | $2,956.60–$5,595.46 | Bigger uptrend looks damaged, but not broken |
| First support | $4,500 | Initial support level |
| Next support | $4,390 | Late-March futures low zone |
| Major support | ~$4,124 | Month’s panic low |
| First resistance | $4,650 | Initial upside barrier |
| Next resistance | $4,775 | Secondary resistance |
| Key recovery zone | $4,900–$5,000 | Needs to be reclaimed to suggest the washout is over |
Technically, this is a deep correction, but not yet a full structural breakdown. Gold has lost momentum, but as long as it stays above its major moving-average support zones, the longer-term trend is weakened rather than fully broken.
Not necessarily. A bad month does not cancel gold's long-term role. What changed in March was the market's short-term priority. Investors prioritized yields, inflation, cash needs, and policy expectations over gold's defensive image. When those pressures cool, gold can recover quickly, as shown by its rebound attempts late in the month.
In summary, gold can still be a safe haven over longer periods; however, it can experience severe downturns when the market must adjust rates and liquidity simultaneously.
Yes, but not on every time horizon. Gold can hedge inflation over longer cycles, while still falling sharply in the short run when rising inflation pushes real yields and the US dollar higher.
DXY gained about 2.0% across March, which amplified the pressure already coming from higher nominal and real Treasury yields.
Not necessarily. It was more due to macro repricing and forced liquidation than a collapse in strategic demand.
Gold experienced its worst month since 2008 in March 2026, driven by a real-yield shock rather than a decline in safe-haven demand. XAU/USD declined amid a surge in oil prices, which altered Fed expectations, boosted the dollar, and increased the opportunity cost of holding a non-yielding asset.
The next big levels are $4,500 on the downside and $4,650 on the upside. If real yields stay elevated, gold remains vulnerable to another flush. If yield pressure eases and DXY slips back below 100, March may end up looking more like a brutal reset than the end of the broader bull trend.
Disclaimer: This material is for general information purposes only and is not intended as (and should not be considered to be) financial, investment or other advice on which reliance should be placed. No opinion given in the material constitutes a recommendation by EBC or the author that any particular investment, security, transaction or investment strategy is suitable for any specific person.