Published on: 2026-04-17
Updated on: 2026-04-17
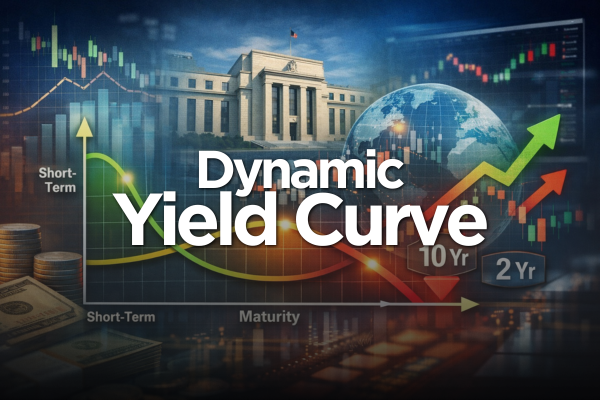
The yield curve, also called the term structure of interest rates, shows how yields differ across bonds of similar credit quality but different maturities. In practice, investors often focus on government bond curves, especially U.S.
Treasury yields, because they serve as key benchmarks for pricing loans, mortgages, and other financial assets. When people talk about a dynamic yield curve, they usually mean analysing how it changes over time, not just viewing a single snapshot.

A dynamic view of the yield curve tracks how yields change across maturities over time, rather than presenting a single chart.
The most important changes are shifts in level, slope, and curvature.
Steepening, flattening, and inversion can signal changing expectations for growth, inflation, monetary policy, and risk premiums, but no single curve move should be used in isolation.
The yield curve matters because it influences how investors think about bonds, equities, foreign exchange, and the broader economy.
A dynamic yield curve is the yield curve viewed as a process that evolves over time. Instead of asking only whether the curve is normal, flat, or inverted today, the dynamic approach asks how the curve is shifting, how fast it is moving, and which maturities are driving the change.
This matters because curves can change through parallel shifts, steepening, flattening, or more complex curvature changes.
A simple way to think about it is this: a static yield curve is a photo, while a dynamic yield curve is a sequence of observations that shows how the market is repricing.
A yield curve plots yields against time to maturity for similar debt instruments. In the U.S., the Treasury curve is the most widely watched version. Analysts often break changes in the curve into three core factors: level, slope, and curvature.
Level describes a broad move higher or lower in yields, slope describes the gap between short and long maturities, and curvature describes changes in the middle of the curve relative to the short and long ends.
The main drivers are usually monetary policy, inflation expectations, growth expectations, term premiums, and supply-demand conditions in government bond markets. Because U.S. yields also influence global financial conditions, curve moves can spill into equities, foreign exchange, credit, and international bond markets.
A parallel shift happens when yields across most maturities move up or down by a similar amount. This is mainly a level change. It matters for duration and broad bond-price sensitivity.
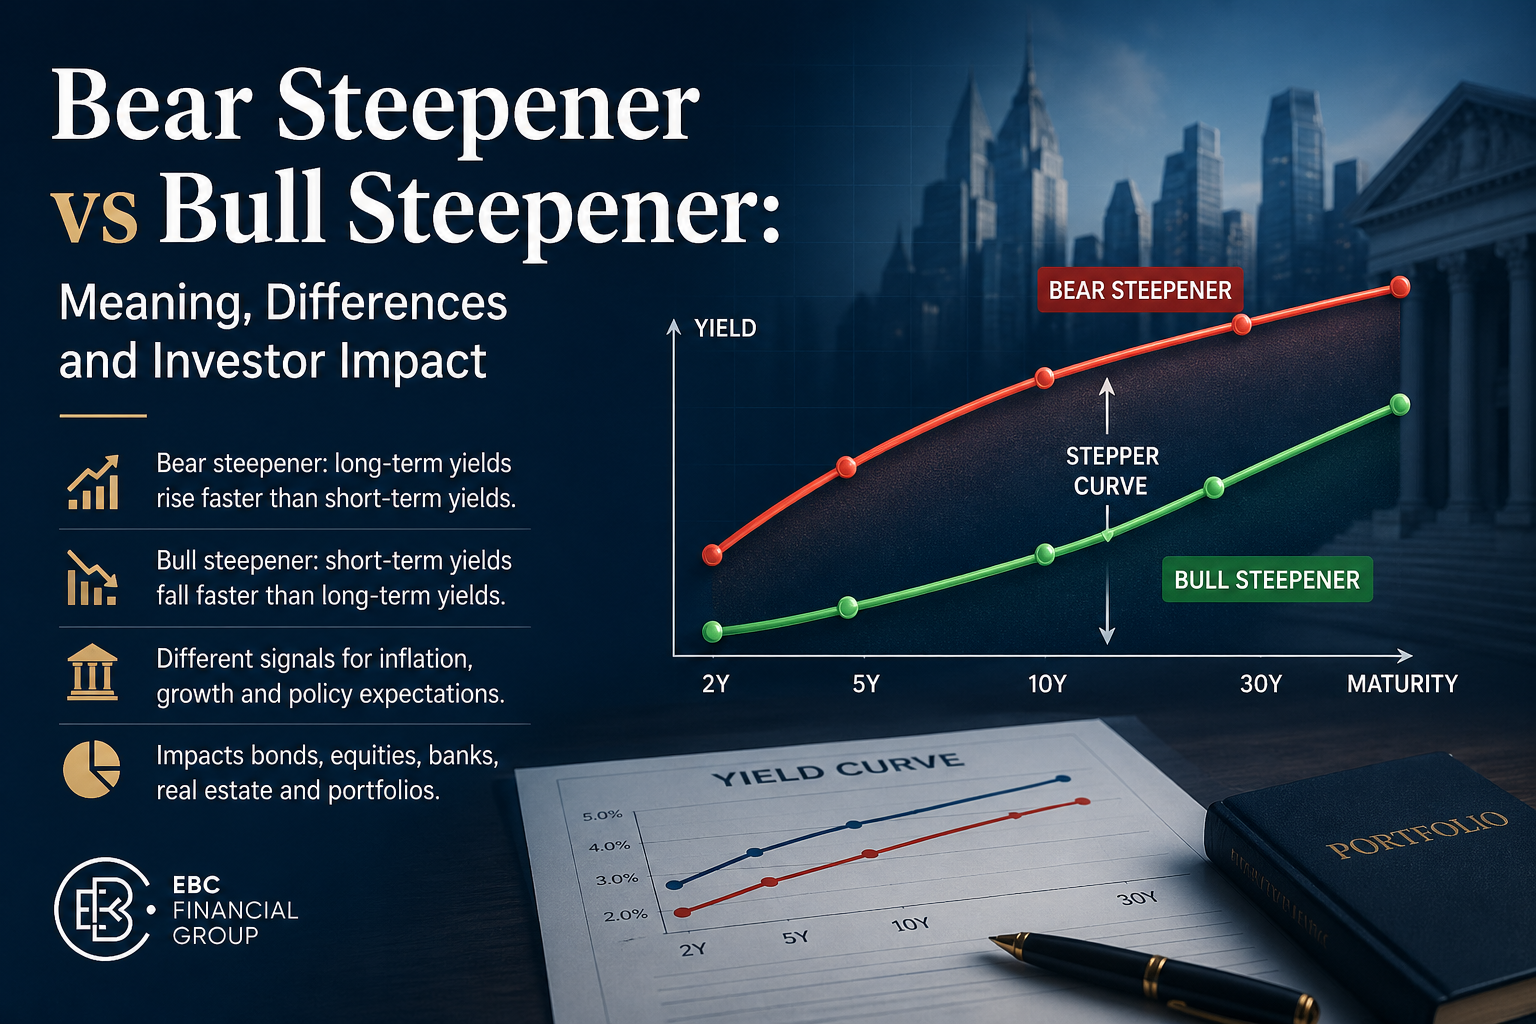
A steepening move means the gap between long-term and short-term yields widens. This can happen when short-term yields fall, when long-term yields rise, or when both ends move by different amounts. Analysts sometimes describe these as bull steepeners and bear steepeners, depending on whether yields are mainly falling or rising.
A flattening move means the gap between long-term and short-term yields narrows. This often happens when short-term yields rise relative to long-term yields, or when long-term yields fall more than short-term yields. Flattening can reflect tighter monetary policy, weaker growth expectations, or both.
An inversion occurs when shorter-term yields rise above longer-term yields. In the U.S., common spreads include 10-year minus 2-year and 10-year minus 3-month, while the New York Fed’s recession model uses the 10-year minus 3-month spread.
Historically, an inverted curve has often preceded U.S. recessions, but it does not tell investors exactly when a downturn will begin or how severe it will be.
The yield curve is more than a bond-market chart. It serves as a benchmark for pricing other assets, including bank loans, mortgages, and corporate bonds. That is why changes in its shape and direction matter for investors, businesses, and policymakers.
A dynamic view is especially useful when markets are repricing quickly in response to inflation data, employment reports, central bank guidance, or changes in bond supply and risk sentiment. In those moments, the speed and composition of the move often matter as much as the final shape of the curve.
A steepening curve can support sectors that benefit from wider lending spreads, while flatter or inverted curves often lead investors to pay more attention to defensives and balance-sheet quality. Growth-oriented assets can also react strongly when longer-term yields move because discount rates change.
Bond investors use curve analysis to manage duration, choose between short- and long-maturity bonds, and structure steepener or flattener trades. Professional fixed-income strategies often separate a general duration view from a yield-curve view so that investors can express a more precise opinion about where the move will occur.
Because relative yield expectations influence capital flows and rate differentials, yield curve changes can affect currencies as well as bonds and equities. This is one reason U.S. curve moves often matter outside the United States.
The dynamic yield curve is useful, but it is not a standalone forecasting tool. Large central bank bond holdings, heavy government issuance, safe-haven flows, regulation, and shifts in term premiums can all distort the signal.
Even when inversion matters, timing remains uncertain. Investors should use the curve alongside inflation, labour-market, credit, and earnings data.
It helps show how market expectations are changing across maturities, rather than just what the curve looks like at any given moment. That can reveal changes in expectations for policy rates, inflation, growth, and risk premiums.
The curve itself is the same concept. The difference is analytical: a normal yield curve description is a snapshot, while a dynamic view tracks how the curve evolves over time.
It can help flag rising recession risk, especially when key spreads invert, but it should not be treated as a precise timer. The New York Fed continues to publish a recession-probability model based on the 10-year minus 3-month Treasury spread, which shows why this signal is still monitored closely.
For most readers, the U.S. Treasury curve is the clearest starting point because it is widely followed and heavily used as a benchmark in global markets.
The dynamic yield curve is best understood as a way to track how the yield curve evolves over time. By focusing on level, slope, curvature, and the drivers behind each move, investors get a more useful picture than they would from a single snapshot alone.
It is a powerful framework for reading the bond market, but it works best when combined with other macro and market indicators.