Published on: 2026-07-10
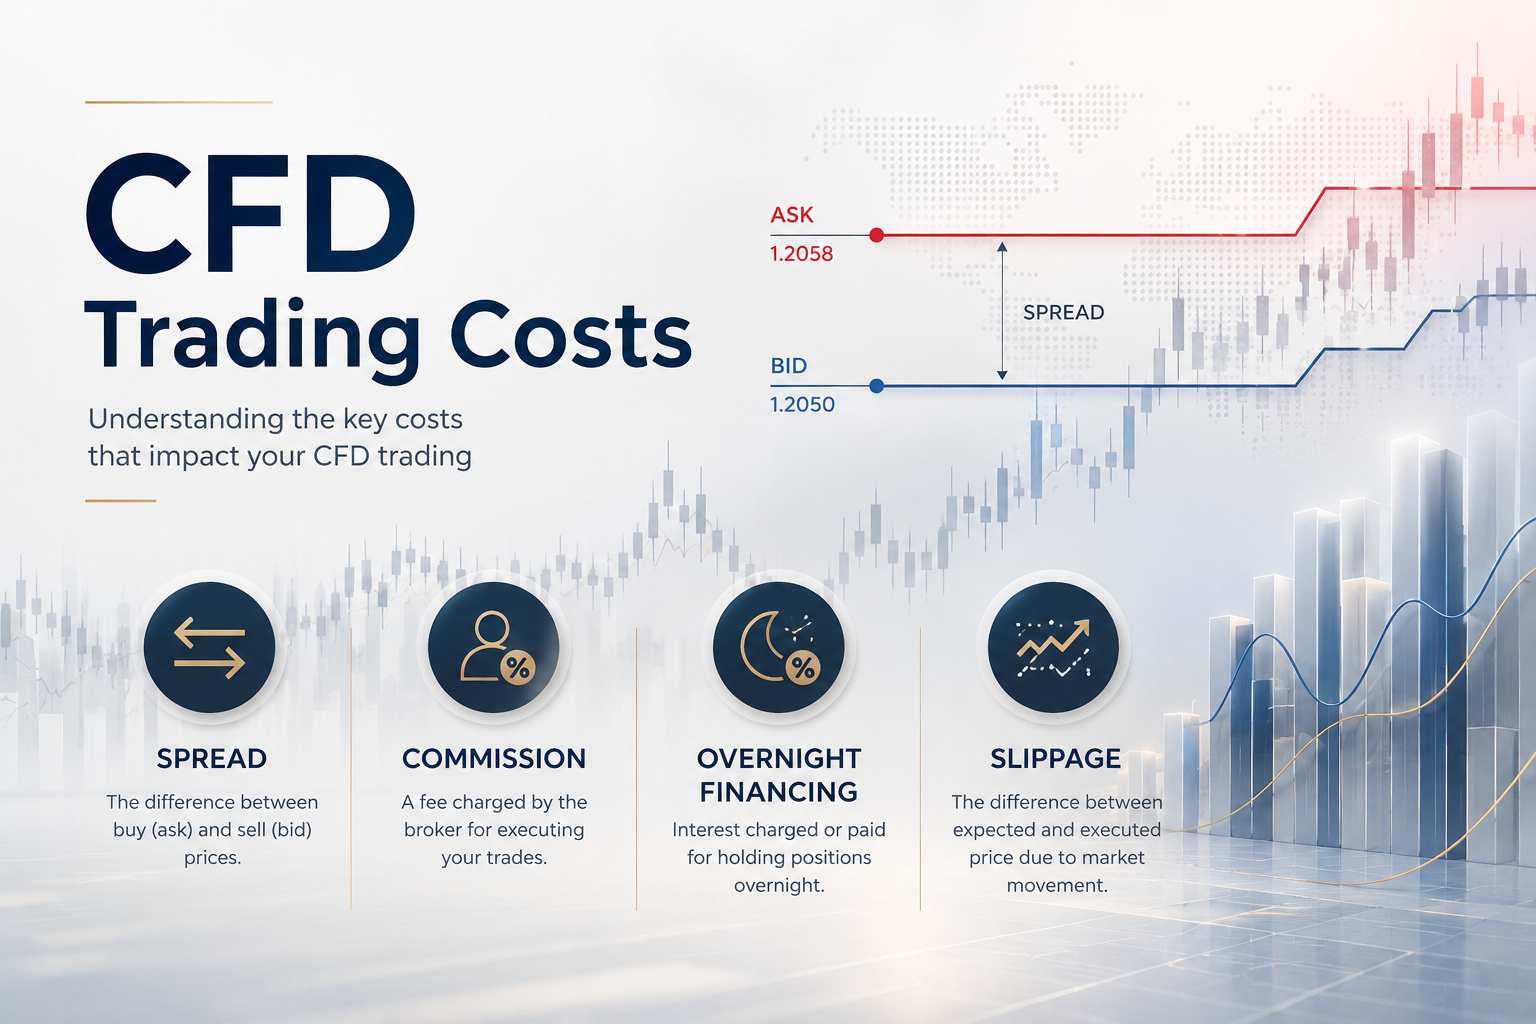
A trade can move in the right direction and still lose money. That is because CFD trading costs must be covered before a position reaches breakeven. The spread is usually the first cost traders notice, but it is rarely the only one.
Commission, slippage, overnight funding and currency conversion can all reduce the final result. Some costs apply as soon as a position opens. Others build over time. Understanding how they work together helps traders judge whether a potential move is large enough to justify the trade.
Total CFD cost may include spread, commission, slippage, overnight funding and currency conversion.
A trade reaches breakeven only after the market has moved far enough to cover all applicable costs.
Spread and slippage matter most for short-term trades.
Overnight funding becomes more important when positions remain open for several days.
Most costs are tied to the full position size, not just the margin required to open it.
Traders can think about CFD costs in two stages.
The first is the cost they can estimate before opening the position. This may include the quoted spread, commission, likely overnight funding and a reasonable allowance for slippage.
The second is the final cost after the position closes. This includes the prices at which the trade was actually filled, the number of nights it remained open and any other charges that applied.
A simple total-cost formula is:
Total CFD cost = spread + commission + slippage + overnight funding + currency conversion + other applicable charges
| Cost Type | What It Includes | When It Applies |
|---|---|---|
| Trading Cost | Spread and commission | When entering and exiting the trade |
| Order Cost | Slippage | When the order is executed |
| Holding Cost | Overnight funding | While the trade remains open |
| Other Cost | Currency conversion or other applicable charges | When relevant |
Margin is not a fee. It is the amount required to open and maintain a leveraged position. However, many CFD costs are based on the full position size rather than the smaller margin deposit.
Different CFD markets use different pricing models. A trader comparing only the headline spread may therefore miss the largest charge.
| Asset Class | Example Position Size | Typical Pricing Input | Example Opening Cost | Main Holding Cost |
|---|---|---|---|---|
| Major Forex CFD | $10,000 | 1.0-pip spread | About $1 | Currency swap |
| Index CFD | $10,000 | 0.02% spread | $2 | Cash-index funding |
| Share CFD | $10,000 | 0.10% commission per side | About $20 round trip (before spread) | Funding on the full position |
| Gold CFD | 10 ounces | $0.30 spread | $3 | Daily funding or futures carry |
| Cryptocurrency CFD | $10,000 | 0.20% spread | $20 | Daily funding |
All figures in this article are examples only and are not live EBC pricing. Actual costs vary by instrument, account type, market conditions and jurisdiction.
The table shows why direct comparisons can be misleading. A forex trade may have a very small opening cost but still build up swap charges. A share CFD may have a wider commission burden from the start, especially if a minimum fee applies. Cryptocurrency CFDs may look manageable during quiet periods but become much more expensive when spreads widen sharply.
The cheapest market at entry is not always the cheapest market to hold.
The spread is the difference between the bid and ask prices.
A long position usually opens at the ask price and closes at the bid. A short position usually opens at the bid price and closes at the ask price. This means a new position often begins with a small loss equal to the spread.
The cost can be estimated as: Spread cost = spread in points × value per point.
For example, if an index CFD has a one-point spread and the position is worth $5 per point, the opening spread cost is about $5.
The actual cost may change before the trade closes. If the market becomes less liquid and the spread widens, exiting the position can be more expensive than expected.
Some CFD products charge a separate commission. This is common with share CFDs and some account types.
If commission applies when opening and closing, the total is: Round-trip commission = opening commission + closing commission
Minimum commission charges matter most on small positions. A $10 commission on a $2,000 trade equals 0.50% of the position. The same $10 charge on a $20,000 trade equals only 0.05%.
This does not mean larger positions are safer. It only shows that fixed charges take up a larger share of smaller trades.
Slippage happens when an order is filled at a different price from the one shown when it was placed.
This is most common when prices are moving quickly or when there is not enough liquidity at the requested level. A trader may click to buy at 1.1000 but receive a fill at 1.1002. That two-point difference becomes part of the trade’s cost.
Slippage is especially important for:
Market orders during major news
Stop-loss orders in fast markets
Trades placed around market openings
Large orders in thin markets
Limit orders give more control over price, but they may not be filled. Market orders are more likely to execute, but the final price may differ from the quote.
Spreads tend to widen when the market becomes harder to price.
During a central bank decision, an inflation release, or a sudden geopolitical event, prices can move several times in a fraction of a second. Liquidity may fall as traders place or cancel orders or wait for the market to settle. Brokers and liquidity providers may then quote a wider bid-ask spread.
| Market Condition | Spread | Estimated Slippage | Estimated Total Entry Cost |
|---|---|---|---|
| Normal trading session | 0.8 points | 0.1 points | 0.9 points |
| Major news release | 2.4 points | 0.8 points | 3.2 points |
In this example, the cost rises from 0.9 points to 3.2 points. The position size has not changed, but the trade must now move more than three times as far before it reaches breakeven.
This is why a strategy that works during calm trading hours may perform very differently around major events.
Cash CFDs held past the daily cut-off may incur overnight funding.
A simplified calculation is: Daily funding = position value × annual funding rate ÷ 365
The exact method varies by instrument. Some markets use a 360-day basis. Forex positions may use tom-next pricing or interest rate differentials between two currencies. Weekend charges may also be applied on one day as a multi-day adjustment.
Long and short positions can have different rates. A short position does not always receive funding. Borrowing costs and broker adjustments may still create a charge.
Assume a $10,000 position has an initial cost of $6 and daily funding of $1.64.
| Holding Period | Initial Cost | Funding Cost | Total Cost | Breakeven Move |
|---|---|---|---|---|
| Intraday | $6.00 | $0.00 | $6.00 | 0.060% |
| 1 night | $6.00 | $1.64 | $7.64 | 0.076% |
| 5 nights | $6.00 | $8.22 | $14.22 | 0.142% |
| 20 nights | $6.00 | $32.88 | $38.88 | 0.389% |
The table shows how quickly holding costs can overtake entry costs.
A useful calculation is the funding crossover: Funding crossover = initial cost ÷ daily funding
In this example: $6 ÷ $1.64 = 3.7 nights
After roughly four nights, the accumulated funding exceeds the original entry cost.
This can affect the choice between a cash CFD and a dated contract. Cash CFDs may suit shorter trades, while dated products may be better for longer holding periods, when daily funding would otherwise compound.
Consider a $10,000 CFD position that gains 1.00%.
The gross profit is $100. However, the final result depends on the costs paid along the way.
| P&L Item | Amount |
|---|---|
| Gross Profit | $100.00 |
| Spread | -$4.00 |
| Slippage | -$2.00 |
| Overnight Funding (3 nights) | -$4.92 |
| Net Profit | $89.08 |
The total cost is $10.92. The breakeven percentage is: $10.92 ÷ $10,000 × 100 = 0.1092%
The market therefore needs to move by just over 0.10% in the trader’s favour before the position begins to make a net profit.
A smaller move may look profitable on the chart but still produce a loss after costs. A gross gain of $10, for example, would become a net loss of $0.92.
Before opening a position, traders should ask:
What is the current spread?
Is commission charged on one side or both?
How much slippage is realistic in current conditions?
How many nights could the trade remain open?
Does currency conversion apply?
How far must the market move to cover all costs?
What share of the profit target will those costs consume?
The final question is especially important. Cost-to-target ratio = total expected cost ÷ gross profit target × 100
A $10 cost takes up 20% of a $50 profit target. The same $10 cost takes up only 2% of a $500 target.
This helps explain why very short-term strategies can struggle even when the spread appears small. If the expected move is limited, costs take up a larger share of the potential profit.
It depends on the market and how long the trade remains open. Spread and slippage are often the primary costs in intraday trading. Commission may matter more for share CFDs, while overnight funding can become the highest cost on positions held for several days.
No. Margin is the amount of money needed to open and maintain a leveraged position. It is not deducted as a charge. However, profits, losses and many costs are based on the full position size.
Add the spread, commission, expected funding, slippage and other charges. Then divide the total by the value per point, pip or unit. The result shows how far the market must move in the trader’s favour before the position becomes profitable.
It can be allowed for, but it cannot be known exactly. The likely amount depends on market liquidity, position size, order type and volatility. Slippage is usually higher during fast-moving markets.
No. Long and short rates are calculated separately. A short position may still incur charges due to borrowing costs, benchmark rates, or product-specific adjustments.
The cheapest trade is not always the one with the smallest spread. A position held for several days may cost far more in funding than it does in entry fees. Looking at the total cost before entering a trade helps traders assess whether the potential reward justifies the expense.