Published on: 2026-05-20
Updated on: 2026-05-20
Buying is usually effective when market conditions are orderly. After a sharp spike in volatility, that assumption becomes weaker. A decline may no longer reflect investors’ repricing of earnings, growth, or valuation. It may show leveraged funds, risk models, and hedged positions, thereby reducing exposure.
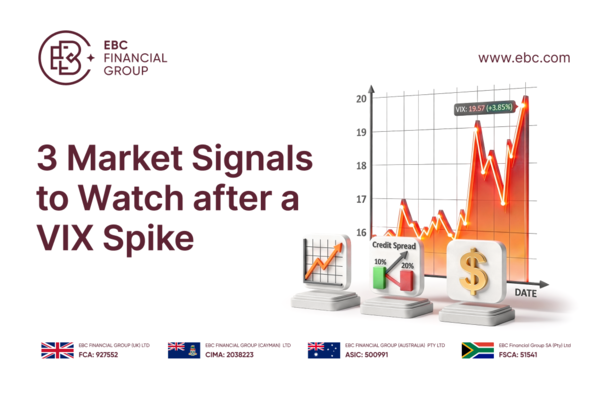
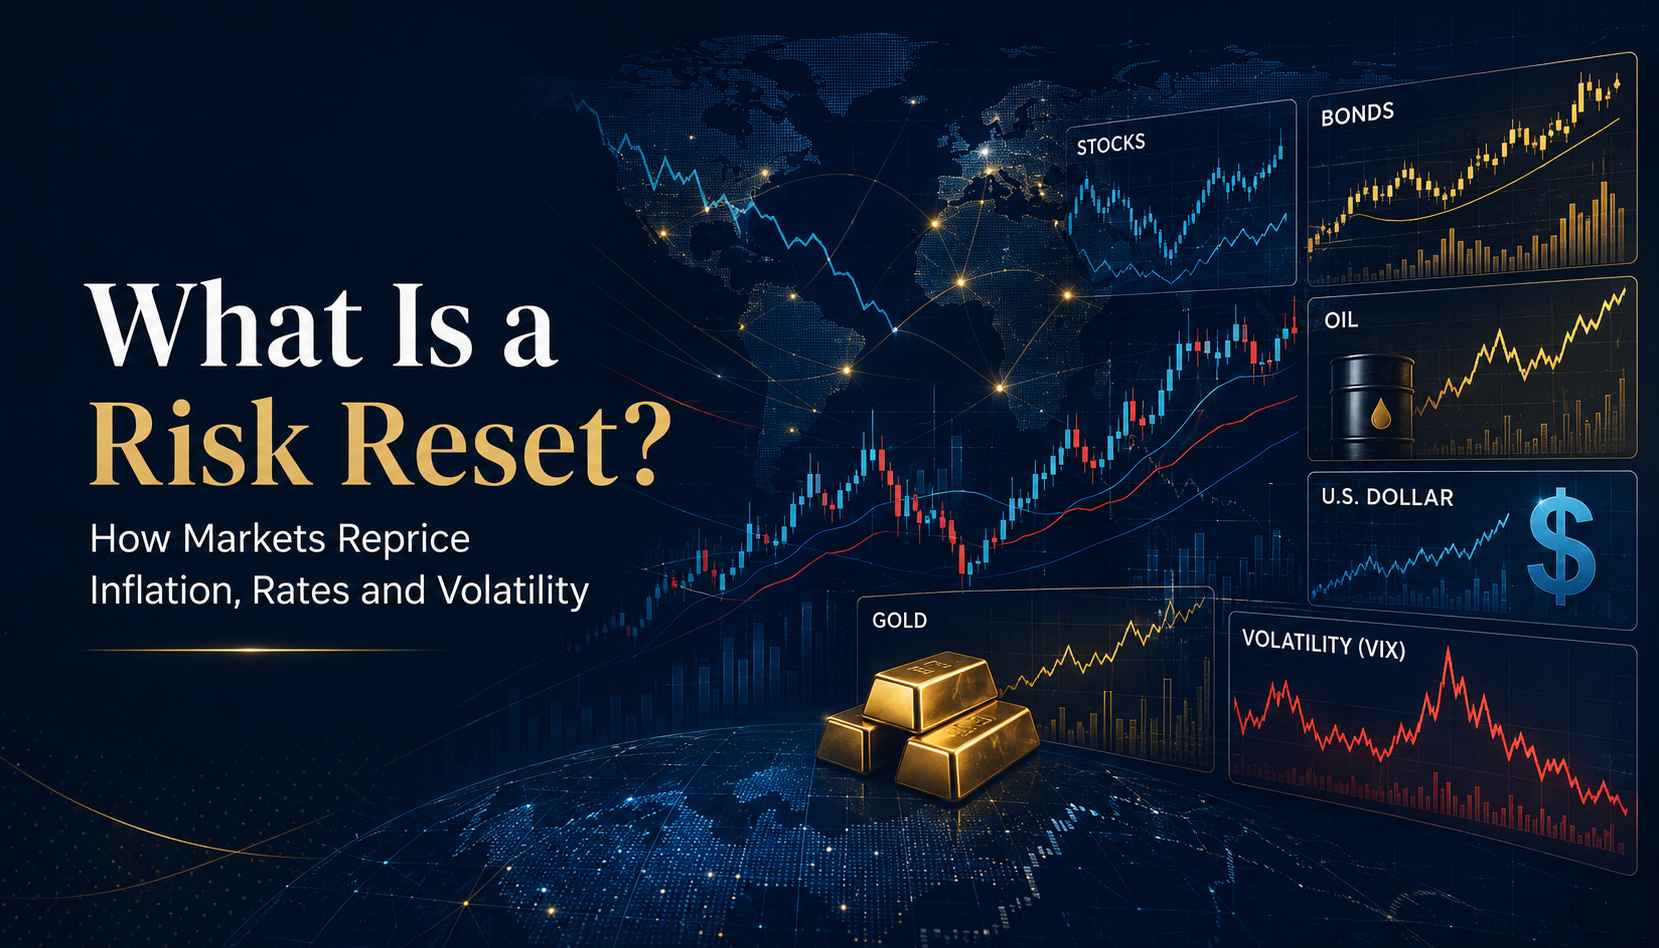
The Cboe Volatility Index (VIX), which measures expected near-term volatility based on Standard & Poor’s 500 Index (S&P 500) options prices, helps traders track that shift. It is often called Wall Street’s “fear gauge” because it shows how much investors are willing to pay for protection when markets become harder to price.
The VIX should not be considered a bottom-calling tool. You only get the fuller picture when you view it alongside the VIX curve, credit spreads, and currency pressure. Combine those signals, and traders can gauge whether a sell-off is still snowballing or starting to find its feet.

A rising VIX shows that investors are paying more for protection. A move above 20 usually signals greater caution, while one above 30 suggests deeper stress. In major sell-offs, the VIX can rise far beyond those levels.
A high reading does not mean the sell-off is ending, and a low reading does not mean the market is stable. Traders need to ask whether the VIX is rising briefly before settling, or making higher highs as equities weaken.
Volatility can also create its own selling pressure. Some funds reduce exposure when volatility rises because their risk limits tighten. Some traders sell when falling prices reduce the value of their collateral. Carry trades can add further pressure when investors who borrowed in low-yielding currencies, such as the yen, rush to unwind positions as the funding currency strengthens.
At that stage, selling is shaped less by market opinion and more by whether investors still have the capacity to hold their positions.
The August 2024 market turbulence showed how quickly this can happen. Bank for International Settlements (BIS) Bulletin No. 90 said Japanese markets were hit by the unwinding of leveraged positions and carry trades after the weekend of 2 to 5 August 2024. The Tokyo Stock Price Index (TOPIX) fell 12% on 5 August, the S&P 500 lost another 3.0%, and the VIX briefly moved above 60 outside regular trading hours. The BIS also described the episode as another case of volatility being worsened by procyclical deleveraging and margin increases.
Markets can often catch their breath while forced liquidations continue to play out behind the scenes. That is why experienced traders often look beyond the initial recovery.
The first clue is whether each new wave of selling elicits a smaller volatility response than the last. The VIX does not need to return to normal immediately. It can stay elevated even after the worst selling has passed.
Traders can compare the latest VIX spike with previous peaks. If the S&P 500 declines again but the VIX does not exceed its earlier high, demand for protection may be stabilising.
The August 2024 episode illustrates this point. The BIS reported that the VIX briefly exceeded 60 at the peak, then retreated to lower, though still elevated, levels by week’s end. Equity markets stabilised quickly, with the S&P 500 recovering its losses by Friday, 9 August.
Not every extreme VIX spike signals a bottom. The shift in behaviour is more revealing. When prices remain volatile, but the VIX stops reaching new highs, the market may be moving from panic selling to more orderly trading.
A stock index may rebound as short-term traders cover positions, but the recovery remains fragile if volatility continues to climb behind it. A stronger signal appears when prices stabilise and the VIX stops rising, roughly at the same time.
The VIX futures curve shows how traders are pricing volatility across different timeframes.
In calm markets, longer-dated VIX futures usually cost more than near-term contracts. During stress, this can reverse, with near-term protection becoming more expensive than protection further out. This is known as backwardation.
Backwardation shows that traders are paying more for immediate cover. The deeper it goes, the more the market treats the current shock as urgent rather than distant.
The curve does not need to normalise fully before equities recover. The more relevant change is whether the front of the curve stops rising in price. If near-term volatility remains heavily elevated, traders are still paying a premium for immediate protection. If that premium narrows, urgent hedging demand may be fading.
The spot VIX shows the price of near-term protection. The curve shows whether traders expect stress to fade quickly or remain embedded.
A brief volatility spike can create opportunities once panic subsides. Prolonged stress in the curve makes dip-buying riskier, as the options market is still pricing for a disorderly environment.
Equity markets rarely calm down in isolation.
Credit spreads show the extra yield investors demand to hold corporate debt rather than government bonds. When spreads widen, investors are pricing more credit risk and tighter financial conditions.
If equities are bouncing but credit spreads are still widening, the stock market may be recovering faster than the funding market. That is a weaker setup. Companies may still face rising borrowing costs, and investors may continue to reduce risk elsewhere.
The International Monetary Fund (IMF) has warned that forced selling by leveraged non-bank financial intermediaries can increase volatility and tighten funding conditions during market stress. Credit spreads, therefore, help test whether an equity rebound rests on firmer ground or is still fighting unresolved funding pressure.
Currency markets can show whether stress is still travelling. During global volatility shocks, investors often seek safer currencies such as the United States dollar (US dollar), Swiss franc, or Japanese yen. The yen is especially important because of its role in carry trades. When volatility rises, investors may repay yen funding, strengthening the yen and pressuring other assets. A currency move can then spill back into equities and other risk assets, even when the initial shock originated elsewhere.
For emerging-market traders, this currency signal is worth tracking because local pressure can linger even after US equities bounce. Continued sharp declines in local currencies against the US dollar suggest ongoing pressure to liquidate. If currency movements stabilise, global risk appetite may be recovering.
The signals work best in combination.
SIGNAL |
HEALTHIER SIGN |
RISKIER SIGN |
VIX direction |
The VIX stops making higher highs |
The VIX keeps rising with each equity sell-off |
VIX curve |
Backwardation begins to ease |
Near-term volatility remains much more expensive |
Credit spreads |
Spreads stop widening |
Corporate borrowing stress keeps rising |
Currency markets |
The dollar, yen, or franc stop surging |
Safe-haven currencies keep strengthening sharply |
The checklist is not meant to predict the exact low. It helps traders distinguish between a short-term rebound and a market moving towards greater stability.
During a typical dip, investors focus on valuation, earnings, and the economic outlook. In a volatility shock, market structure is the primary concern. Waiting for confirmation may miss the bottom, while acting too soon risks buying amid ongoing liquidation.
A VIX spike does not settle the buy-or-sell question by itself.
After a sharp rise in volatility, traders need to know whether the selling is still driven by urgent hedging and forced position cuts, or if funding pressure has begun to ease. The VIX curve shows whether panic is concentrated in the near term. Credit spreads and currency markets help confirm whether stress is easing across the wider system.
August 2024 showed how incomplete the first move can be. Although the shock was severe, pressure eased quickly, and equity markets recovered within days. In a slower, more prolonged sell-off, a similar VIX spike could signal something different.
After a volatility spike, the key question is not whether the market has declined enough, but whether the pressure behind the decline remains.