Published on: 2026-01-27
Updated on: 2026-01-27
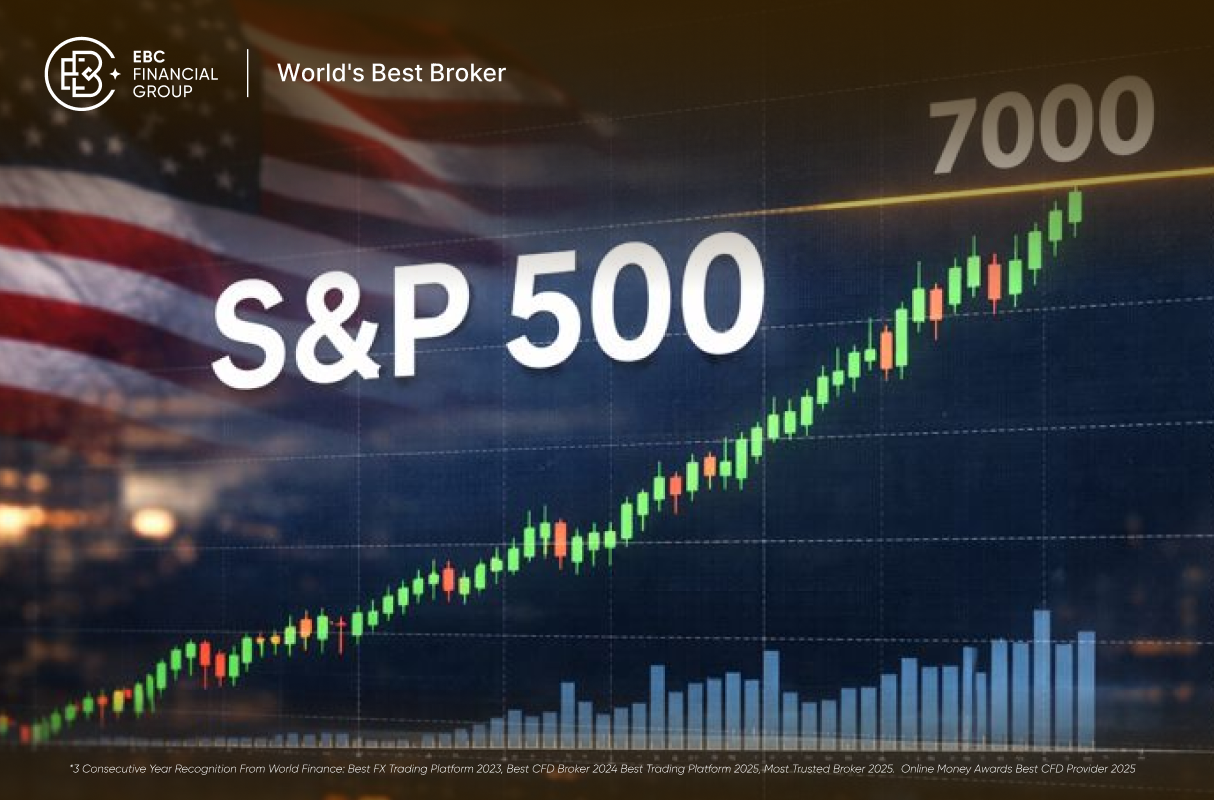
This week intensifies focus on the psychological 7,000 level. The Federal Reserve’s Federal Open Market Committee (FOMC) meets on 27-28 January, with a policy statement expected on Wednesday, 28 January. Concurrently, earnings reports from the largest market constituents are due, and investors are assessing whether major technology firms can continue to drive index performance.
The question is not only “will it break 7,000?” The better question is: what would make a break stick?

For the S&P 500 to move above 7,000 and stay there, three things usually need to line up:
Recent commentary has pointed to the 10-year yield moving around the low 4% area, which markets often treat as high enough to tighten financial conditions, but not high enough on its own to derail risk appetite.
When valuations are already rich, price gains need real profit delivery. This week’s mega-cap updates matter because those firms still account for a large share of index earnings power and set the tone for risk appetite.
Equities can tolerate periods of subdued growth, but they are challenged by uncertainty that affects both economic growth and inflation. Currently, additional uncertainty arises from delays in US economic data releases, resulting in less timely information for investors.
Put simply, 7,000 is reachable for the S&P 500 if the Fed does not shock markets, earnings land well, and yields do not spike. If any one of those slips, 7,000 can turn into a ceiling.
Last week was volatile. Markets responded to tariff headlines, geopolitical developments, and a strong bid for safe-haven assets.
Then Monday brought a steadier tone. The S&P 500 rose 0.5% to 6,950.23, recovering some of the prior week’s slip. Year-to-date, it is up around 1.5% by Monday’s close.

The other big signal came from outside equities. Gold hit another record, briefly moving above $5,100 per ounce, and silver also surged. Moves like that tend to appear when investors are hedging policy risk, inflation risk, or both.
So, heading into the Fed, the market mood is cautious rather than panicked. Investors appear positioned for a steady decision, but remain sensitive to any shift in tone on inflation, jobs, or the path of rate cuts.
The Federal Reserve’s Federal Open Market Committee (FOMC) meeting runs from 27–28 January. Many reports suggest markets expect the Fed to hold rates steady, with pricing heavily skewed towards a “no change” outcome.
That does not mean the Fed is irrelevant. It means the focus shifts to:
How Chair Powell describes progress on inflation
How the Fed frames labour market conditions and downside risks
Whether the Fed signals rate cuts later in 2026, or pushes back against that expectation
Even if the Federal Reserve maintains its current policy, the subsequent press conference can influence the S&P 500 by shaping investor expectations regarding future interest rate trajectories.
Investors are watching the so-called “Magnificent 7” closely because their results can swing index earnings expectations and sentiment. Coverage this week highlighted a mixed start for those names in early 2026 and listed key reporting dates ahead, including Alphabet (4 Feb), Amazon (5 Feb), and Nvidia (25 Feb), with this week’s focus on names like Microsoft, Meta, Tesla, and Apple.
The market is looking for three messages:
Revenue resilience (is demand holding up?)
Margin discipline (are costs under control?)
Artificial intelligence (AI) investment discipline (is spending tied to a clear payoff?)
If earnings exceed expectations but forward guidance remains cautious, the index may encounter resistance near 7,000. Conversely, confident guidance and sustained share buybacks would likely support the index above this level.
When gold is breaking records and the market is still rising, it tells you something important: investors want upside, but they also want protection.

The same pattern often shows up in volatility pricing. Even a modest lift in expected volatility around event weeks is normal. If implied volatility rises sharply and equities drop, that is when traders start thinking about a deeper risk-off move.
Normally, the last week of January is packed with US macro numbers. This year, schedules have been disrupted. The Bureau of Economic Analysis (BEA) release schedule shows that GDP (advance estimate for Q4 and the year) and Personal Income and Outlays were moved to 20 February.
With fewer fresh official releases, markets lean harder on:
Fed communication
Company guidance
Private surveys and nowcasts (plus market pricing such as Treasury yields, the US dollar, and implied volatility)
The Atlanta Fed GDPNow nowcast most recently estimated Q4 2025 real GDP growth at 5.4% (seasonally adjusted annual rate) as of 22 January.
This combination can increase short-term volatility, as a lack of concrete data allows for greater divergence in market interpretations.

The focus is not only on the Federal Reserve's policy decision, but also on the language in the statement and the post-meeting press conference. The 28 January communication will shape expectations for inflation, growth, and the timing of any rate cuts.
As more mega-cap earnings arrive in early and mid-February, traders will learn whether strong index-level gains are broadening out or narrowing again to a small group of winners.
With significant Bureau of Economic Analysis releases postponed, markets may rely on incomplete information until the official data schedule resumes. This reliance can increase market fragility, particularly near key levels such as 7,000.
The S&P 500 is not under pressure because fundamentals are clearly deteriorating. It is under pressure because valuations and expectations are high, and the event calendar is packed.
From a trading perspective, the situation can be summarised as follows:
Base case: the Fed holds, earnings are “good enough”, and the S&P 500 can probe above 7,000.
Bull case: Powell sounds relaxed about inflation, yields stay contained, and mega-cap guidance reassures markets on margins and AI returns.
Bear case: the Fed's tone is firmer than expected, yields rise, and guidance hints that demand is slowing faster than investors priced in.
If the S&P 500 surpasses 7,000, sustained movement above this level over subsequent sessions is necessary to confirm a breakout. Otherwise, 7,000 may serve as a reference point for risk management.
It is a psychological level. Big round numbers attract trading flows, options activity, and headlines. That can increase short-term swings even though nothing “fundamental” changes at 7,000.
Not always. A hold is widely expected this week. Markets will react more to the Fed’s tone on inflation and future cuts than to the decision itself.
A handful of very large firms can move index profits and investor mood. Their guidance on demand, costs, and AI spending often drives the next leg for the whole market.
Record gold prices can signal demand for hedging against policy risk or inflationary concerns. When gold rises alongside equities, it often means investors are cautiously bullish.
A jump in bond yields, cautious earnings guidance, or a Fed message countering rate-cut expectations can all cap rallies near major levels.
The S&P 500 is approaching the 7,000 threshold, but further progress will depend on sustained momentum rather than short-term news. A meaningful breakout requires the index to remain above 7,000 after an initial pullback and to advance with participation from a broader range of constituents, not solely mega-cap stocks.
In the coming weeks, three key indicators should inform market outlook: the US 10-year Treasury yield, the VIX (Cboe Volatility Index), and gold prices.
In summary, 7,000 should be viewed as a pivotal level. If earnings guidance remains strong and yields are stable, the index may establish support at this threshold. Conversely, rising yields or cautious guidance could push 7,000 to act as resistance and potentially trigger a more significant market correction.
Disclaimer: This material is for general information purposes only and is not intended as (and should not be considered to be) financial, investment or other advice on which reliance should be placed. No opinion given in the material constitutes a recommendation by EBC or the author that any particular investment, security, transaction or investment strategy is suitable for any specific person.