Published on: 2025-10-08
Updated on: 2025-10-08
Unlikely in a single session, but the path is opening. Gold futures crossed the historic $4,000-per-ounce threshold on 7 October for the first time, and the Fed Minutes due at 2:00 PM ET today could provide the next catalyst for further gains towards $4,500.
However, technical analysts point to nearer-term resistance around $4,200–4,300, meaning a direct leap to $4,500 today would require an exceptionally dovish surprise from the minutes combined with continued safe-haven buying.
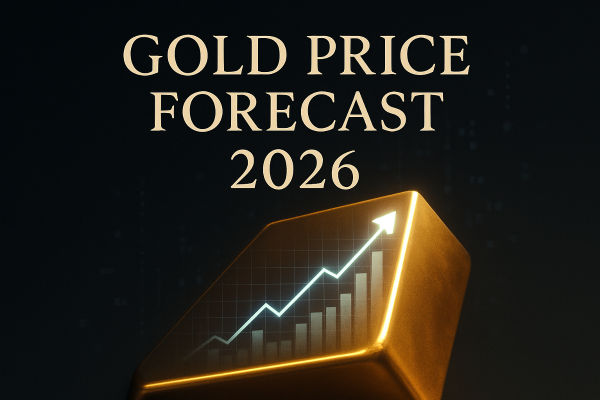
Goldman Sachs has raised its 2026 target to $4,900, citing record ETF inflows and persistent central bank demand, so whilst $4,500 may not arrive today, the trajectory suggests it could be reached within months if current drivers hold. [1]

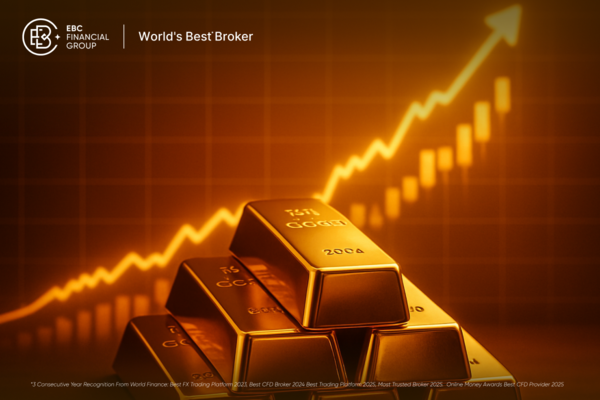
Spot gold settled at $3,962 per ounce on Monday, whilst December futures on the COMEX briefly touched $4,005 before closing around $3,990—marking the first time the metal has traded above the psychologically significant $4,000 level.
The move capped a 50% year-to-date rally that has vastly outpaced equities, bonds, and most other assets.
| Asset | YTD Return | Current Level | vs Gold |
|---|---|---|---|
| Gold | +50.1% | $4,000/oz | Baseline |
| S&P 500 | +18.3% | Record highs | −32 percentage points |
| 10Y Treasury | −4.2% (yield up) | 4.15% yield | −54 percentage points |
| USD Index | −4.0% | 102.5 | −54 percentage points |
Volume surged to $388 billion per day in September—up 34% from August—as traders piled into the rally across COMEX, Shanghai, and over-the-counter markets.
That explosion in activity signals broad-based conviction rather than a narrow speculative push, which typically supports sustained price advances rather than quick reversals.
This rally now rivals or exceeds the two previous major bull runs in scale and speed.
| Cycle | Peak Price | YTD Gain at Peak | Key Driver | Subsequent Pullback |
|---|---|---|---|---|
| 2011 | $1,920 | +35% | EU debt crisis, QE2 | −45% over 4 years |
| 2020 | $2,075 | +28% | COVID-19, Fed zero rates | −15% over 6 months |
| 2025 | $4,000+ | +50% | Fed cuts, shutdown, geopolitics | To be determined |
The current advance has already outpaced both prior peaks in percentage terms, raising questions about sustainability but also reflecting stronger structural demand from central banks and institutions than in previous cycles.
The FOMC Minutes from the 16–17 September meeting will be published at exactly 2:00 PM ET today, and they could determine whether gold extends its run or pauses for consolidation.
Markets are pricing a 96% probability of a quarter-point rate cut at the 28–29 October Fed meeting, down to 3.75–4.00%, and the minutes will reveal whether that confidence is justified.
Gold rallies when real yields fall below 1.5%, as lower rates reduce the opportunity cost of holding non-yielding assets.
Current 10-year TIPS yield: Approximately 1.85% (estimated from market data)
Historical threshold for gold rallies: Real yields below 1.5%
If the Fed cuts 50 basis points by December, real yields could fall to 1.35%, supporting gold prices above $4,300
If today's minutes show broad agreement on further easing and flag heightened concern about labour market "downside risks," real yields will fall further, likely pushing gold prices higher towards the next technical resistance.
With the government shutdown now in its second week and official jobs data still delayed, the minutes take on extra importance as the primary window into Fed thinking before the October decision.
Technical analysis shows gold testing key levels that will determine the next move.
Near-term resistance: $4,200 (technical level), $4,300 (Fibonacci extension)—expected within 2–4 weeks if momentum holds [2]
Psychological target: $4,500—likely by Q4 2025 if Fed Minutes are dovish and rate cuts proceed
Goldman Sachs 2026 target: $4,900—assumes sustained ETF inflows, central bank buying, and a weaker dollar
Support levels: $3,900 (first level), $3,850 (strong support)—entry zones for traders on pullbacks
Chart analysis shows the 9-period moving average has crossed above the 21-period MA—a bullish signal—and momentum indicators remain in positive territory.
Gold is now testing the upper limit of its 20-day Bollinger band near $3,941, which typically suggests either a breakout continuation or a period of consolidation before the next leg higher.
Institutional money has poured into gold-backed ETFs at an unprecedented pace, providing structural support for the rally.
| Period | Inflow | Assets Under Management | Holdings (tonnes) |
|---|---|---|---|
| September 2025 | $17.3B (record month) | $472.5B (all-time high) | 3,838 |
| Q3 2025 | $26B (record quarter) | – | – |
| YTD 2025 | $68B | – | Near Nov 2020 peak |
| Daily volume (Sept) | $8B (+84% MoM) | – | – |
North American investors led the charge, accounting for $16.1 billion of Q3 inflows—the largest third quarter on record and the second-largest quarterly total ever.
European funds added $8.2 billion, falling just $74 million short of their Q1 2020 record, whilst Asian demand contributed $1.7 billion.
The surge in ETF holdings to 3,838 tonnes leaves them just 2% shy of the November 2020 peak of 3,929 tonnes, suggesting room for further accumulation if the rally continues.
Official sector purchases have provided consistent buying pressure even as prices reached all-time highs.
China: Holds 2,264 tonnes as of September; conducted an 18-month buying streak through May before pausing
Kazakhstan: Largest buyer in August; Turkey maintained aggressive purchases throughout Q3
Poland, Bulgaria, El Salvador: Active buyers during the quarter; Poland raised its target gold allocation
Total central bank demand: Represents 15–20% of annual gold demand; provides structural support at all price levels
Unreported purchases: Some nations are acquiring gold without public disclosure, adding to upside surprises
Central banks have added 15 tonnes to global reserves in August alone, returning to buying after a pause in July, and have accumulated 694 tonnes in the first three quarters of 2025.
The World Gold Council notes that whilst the recent price rally has constrained the pace of official purchases, the trend shows no sign of reversing, with central banks keen to diversify away from U.S. debt and hedge currency risk.
Beyond Fed rate-cut expectations, multiple forces are combining to propel the metal to record levels.
Dollar weakness: The USD Index has fallen roughly 4% over the past quarter, making gold cheaper for international buyers and reducing the appeal of dollar-denominated assets
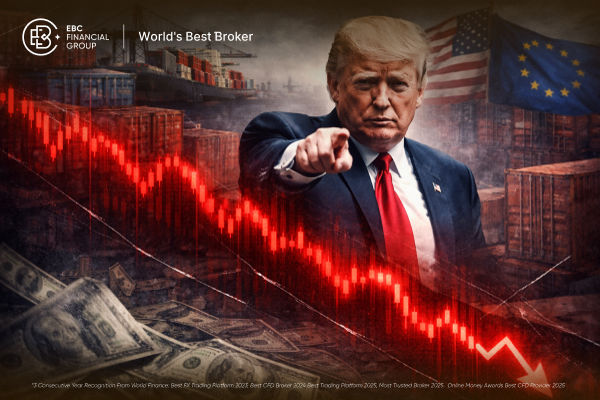
Geopolitical risk: France's political crisis (third PM resignation in under a year), Japan's leadership uncertainty, and President Trump's new 25% truck tariffs have lifted safe-haven demand
Shutdown uncertainty: The ongoing U.S. government shutdown has fuelled concerns about economic data quality and the Fed's ability to set policy with confidence, adding another layer of risk that favours gold
Portfolio diversification: Institutional allocators are raising target weights to gold after its 50% outperformance relative to equities and bonds, reflecting a long-term structural shift
Inflation concerns also persist despite recent cooling, as service prices remain sticky and some analysts warn that aggressive Fed easing could reignite price pressures in 2026.
Despite the strong momentum, several factors could trigger a pullback or a consolidation phase.
Technical exhaustion: Gold has rallied for seven consecutive weeks, and momentum indicators show overbought conditions that historically precede either breakouts or temporary corrections
Hawkish Fed surprise: If today's Minutes reveal significant concern about easing prematurely or show division on the Committee, real yields could rise and trigger profit-taking back towards support at $3,850–3,900
Shutdown resolution with strong jobs data: If Congress reaches a funding deal this week and the delayed September employment report shows unexpectedly robust payroll growth above 200,000, October rate-cut odds could fade and pressure gold lower
Bank of America has specifically flagged "uptrend exhaustion" risks after the recent surge, noting that such rapid advances often lead to temporary consolidation periods. If momentum stalls at current levels, gold could pull back to the $3,850–3,900 support zone before attempting another leg higher. [3]
Whilst a jump to $4,500 in today's session is improbable without an extreme dovish surprise from the Fed Minutes, the fundamental and technical backdrop supports a move to that level over the next few months.
Goldman Sachs's revised $4,900 target for 2026 assumes continued central bank buying at 15–20% of annual demand, sustained ETF inflows above $50 billion annually, and a Federal Reserve that cuts rates more aggressively than currently priced into markets.
If those conditions hold—and geopolitical uncertainty persists—gold could reach $4,500 by early 2026, with interim resistance at $4,200–4,300 providing the next hurdles to clear. For longer-term holders, the risk-reward profile remains favourable as long as real yields stay below 1.5% and economic uncertainty persists.

8 October (today): Fed Minutes tone at 2:00 PM ET sets near-term direction for gold and rate-cut expectations
28–29 October: FOMC meeting decision; markets pricing 96% odds of cut to 3.75–4.00%
November–December: Central bank buying typically accelerates in Q4 as nations finalise year-end reserve allocations
Q1 2026: Goldman Sachs interim target of $4,500; watch for sustained ETF inflows and real yield compression
Support around $3,850–3,900 offers a cushion for potential entry points on pullbacks, whilst the $4,000 level now acts as a psychological floor after Monday's breakthrough.
Today's Fed Minutes will clarify whether the rally accelerates towards $4,200 or pauses for consolidation, but the broader trend—driven by structural demand from central banks, institutional flows, and a weakening dollar—appears intact for the months ahead.
Disclaimer: This material is for general information purposes only and is not intended as (and should not be considered to be) financial, investment, or other advice on which reliance should be placed. No opinion given in the material constitutes a recommendation by EBC or the author that any particular investment, security, transaction, or investment strategy is suitable for any specific person.
[2] https://www.businessinsider.com/gold-price-today-record-high-4000-debt-inflation-economy-2025-10
[3] https://www.tekedia.com/gold-hits-historic-4000-milestone-first-time-in-history/