Published on: 2026-01-26
Updated on: 2026-01-26
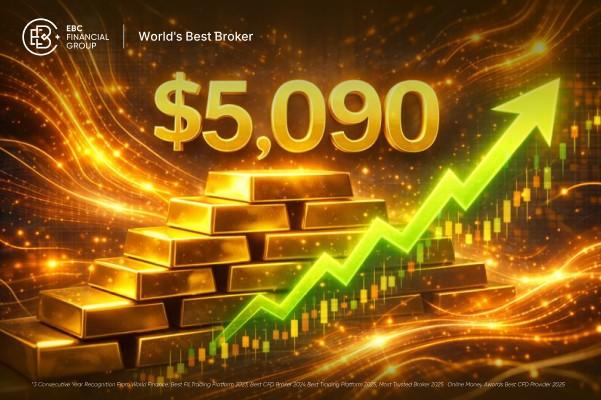
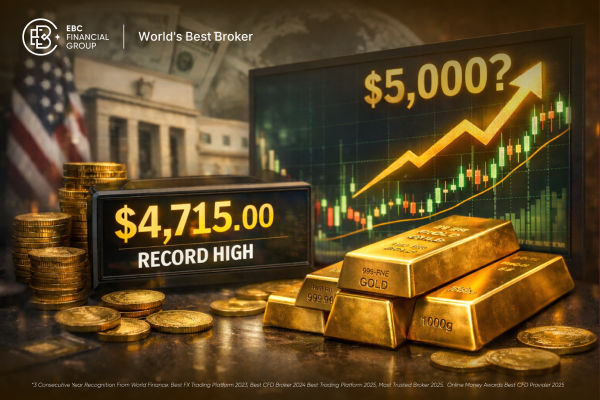
Gold has pushed into price territory that would have sounded impossible just a few years ago. In the latest move, XAU/USD traded through the $5,090 area and printed a new record high near $5,090.81.

At the time of writing, spot gold (XAU/USD) was around $5,080 up about 1.87% on the session, with an intraday range of roughly $4,982.91 to $5,090.81.
Therefore, traders are now asking two simple questions:
Why did gold surge so quickly?
Is the next big milestone $5,400, a level that Goldman Sachs now flags in its updated end-2026 forecast?

Gold broke above $5,090 as investors rushed into safety amid a weakening U.S. dollar, while central bank buying and fresh private demand kept the market tight.
Here are the main drivers behind the move:
Safe-haven demand increased as geopolitical and policy risks rose.
The U.S. dollar softened, which often lifts gold because gold is priced in dollars.
For years, central banks have been significant buyers of gold, and this consistent demand has established a new support level.
A robust technical breakout has added momentum, and current indicators suggest that, while gold may be overextended, it remains in an uptrend.
Gold generally increases in value when investors find it difficult to evaluate risk. For instance, increased geopolitical tensions and tariff uncertainties in 2026 have driven investors towards traditional safe-haven assets.
This is significant because gold has evolved beyond being merely an "inflation story." It is also a confidence story, especially when investors worry about stability in currencies, trade rules, and global alliances.
Gold is priced in U.S. dollars, which makes the dollar act like a gravitational force on gold prices.
When the dollar weakens, gold often rises even if nothing else changes, because global buyers can pay fewer euros, yen, or pounds for the same ounce of metal.
Last week, the dollar fell approximately 1.9% against a basket of major currencies, and such fluctuations can quickly influence gold prices.
Today's market snapshot also showed the Dollar Index down, which lines up with a supportive backdrop for bullion.
Central banks have been buying gold at a pace that would have seemed extreme in earlier cycles. The World Gold Council's data for 2024 shows 1,045 tonnes of net purchases, with buying above 1,000 tonnes for three consecutive years.
That consistent demand can tighten market supply and reduce the impact of short-term profit-taking.
The World Gold Council has also highlighted that many reserve managers expect the U.S. dollar's share of reserves to keep drifting lower over time. In its survey work, 73% of respondents expected the dollar's share to be lower in five years.
Additionally, in its 2025 Central Bank Gold Reserves Survey, the World Gold Council also found that 95% of respondents expect global central bank gold reserves to increase over the next 12 months, and 43% expect their own reserves to increase.
Gold often benefits when reserve diversification becomes a strategic theme.
Goldman Sachs raised its year-end gold forecast to $5,400 per ounce, citing private buyers competing with central banks for bullion.
Goldman also pointed out that the supply of gold does not adjust quickly to higher prices, since most of the gold already exists, and new mine production is relatively small compared to the total stock.
This situation can prolong price rallies beyond what the market anticipates, particularly when inflows into ETFs resume.
Even when fundamentals are supportive, a clean breakout can add fuel to the fire.
On the chart, gold has been printing bullish signals across key indicators, and the price pushed to a fresh 52-week high today.

A move to $5,400 is not a casual call, but it is now part of the mainstream debate because at least one major bank has published that target for year-end.
For context, Goldman Sachs now predicts a price of $5,400 by the end of 2026, up from its previous estimate of $4,900.
Goldman's central argument is that demand has broadened and that central-bank buying remains structurally strong.
If gold is already above $5,000 in January, the market will now focus on whether demand stays intense enough to keep prices elevated rather than mean-reverting lower.
If the U.S. dollar stays weak, gold often stays supported.
If central banks continue to buy assets at a high rate, the market is likely to remain tight.
If demand for private investments, such as ETFs and options, continues to grow, prices may exceed expectations.
If risk-off headlines stay frequent, safe-haven bids can remain steady.
If geopolitical tension cools, safe-haven demand can fade.
If real yields rise, gold can struggle because it does not pay interest.
If the Federal Reserve indicates it plans fewer interest rate cuts than the market anticipates, gold may lose its upward momentum.
On the Fed front, investors are closely watching the upcoming meeting, expecting the Fed to hold rates steady.
From a technical analysis perspective, gold is in a strong uptrend on the daily chart, but momentum is now stretched.
| Indicator | Value | Signal |
|---|---|---|
| RSI (14) | 80.947 | Overbought |
| MACD (12,26) | 42.22 | Buy |
| ADX (14) | 56.635 | Buy |
| ATR (14) | 26.0221 | High volatility |
Daily indicators show the RSI (14) near 80.95, indicating an overbought condition.
| Level (Classic pivots) | Price |
|---|---|
| S1 | 5,038.64 |
| Pivot | 5,062.05 |
| R1 | 5,094.50 |
| R2 | 5,117.91 |
How to Read the Tables:
Bulls often want the price to hold above the pivot area near $5,062 on pullbacks.
Bears often look for a break back below $5,038 to $5,040, because that can signal the breakout is failing in the short term.

The Federal Reserve's official calendar lists the next FOMC meeting for 27–28 January 2026.
When the Fed is close, gold traders watch the dollar, real yields, and guidance tone more than the single rate decision.
Recent coverage of PCE inflation indicates that the market is still debating whether inflation is decreasing quickly enough to justify comfortable rate cuts.
If inflation looks sticky, gold can still rise if investors think policy credibility is weakening, but the path can become more volatile.
If tariff threats return suddenly, gold can move before equities even open.
If tariff risks diminish over a prolonged period, gold typically requires another catalyst, like a weaker dollar or increased ETF inflows, to maintain its upward momentum.
Gold broke above $5,090 as safe-haven demand rose and the U.S. dollar weakened. Central bank buying and renewed private demand also helped keep upward pressure on prices.
A move to $5,400 is achievable, depending on factors like a weaker dollar, continued central bank purchases, and persistent demand for safety. Goldman Sachs has published a $5,400 year-end target, which keeps that level in focus.
Gold looks overbought on some daily indicators. For example, the RSI (14) reading near 80.95 is in overbought territory, which can increase the risk of sharp pullbacks even in a strong uptrend.
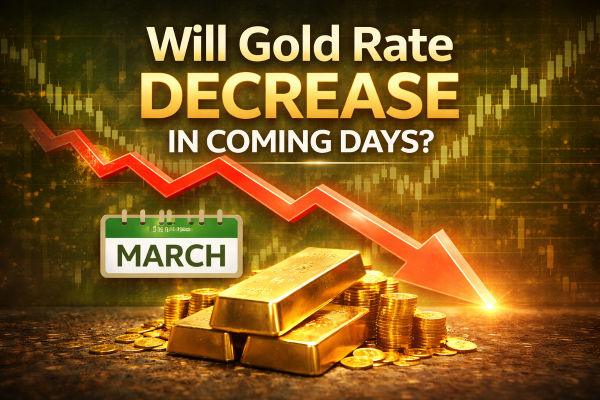
A sustained easing in trade risk, a stronger U.S. dollar, or a sharp rise in real yields can cool gold demand and trigger profit-taking after a fast rally.
In conclusion, gold's break above $5,090 is not just a chart event. It reflects a market that is paying up for safety, leaning against a softer dollar, and still absorbing strong long-term demand from central banks and private investors.
The next phase will depend on whether the risk backdrop stays tense and whether rates and the dollar remain supportive.
If those tailwinds stay in place, $5,400 becomes a realistic discussion. If they fade, gold can still pull back hard even inside a longer-term uptrend.
Disclaimer: This material is for general information purposes only and is not intended as (and should not be considered to be) financial, investment or other advice on which reliance should be placed. No opinion given in the material constitutes a recommendation by EBC or the author that any particular investment, security, transaction or investment strategy is suitable for any specific person.