Financial markets are emotional theatres. They rise on optimism, fall on fear, and fluctuate between greed and caution. Yet beneath every price swing lies a measurable rhythm, a pulse that traders can observe through a single number known as the Volatility Index, or VIX. It translates human sentiment into statistics, showing how nervous or confident investors feel about the future.
For traders and analysts, understanding the Volatility Index is like learning the language of market emotion. It doesn’t tell you whether stocks will rise or fall tomorrow, but it shows you how violently they might move when emotions boil over. In a year defined by uncertainty and fast-shifting expectations, mastering this indicator is essential for staying one step ahead.
What Is the Volatility Index?
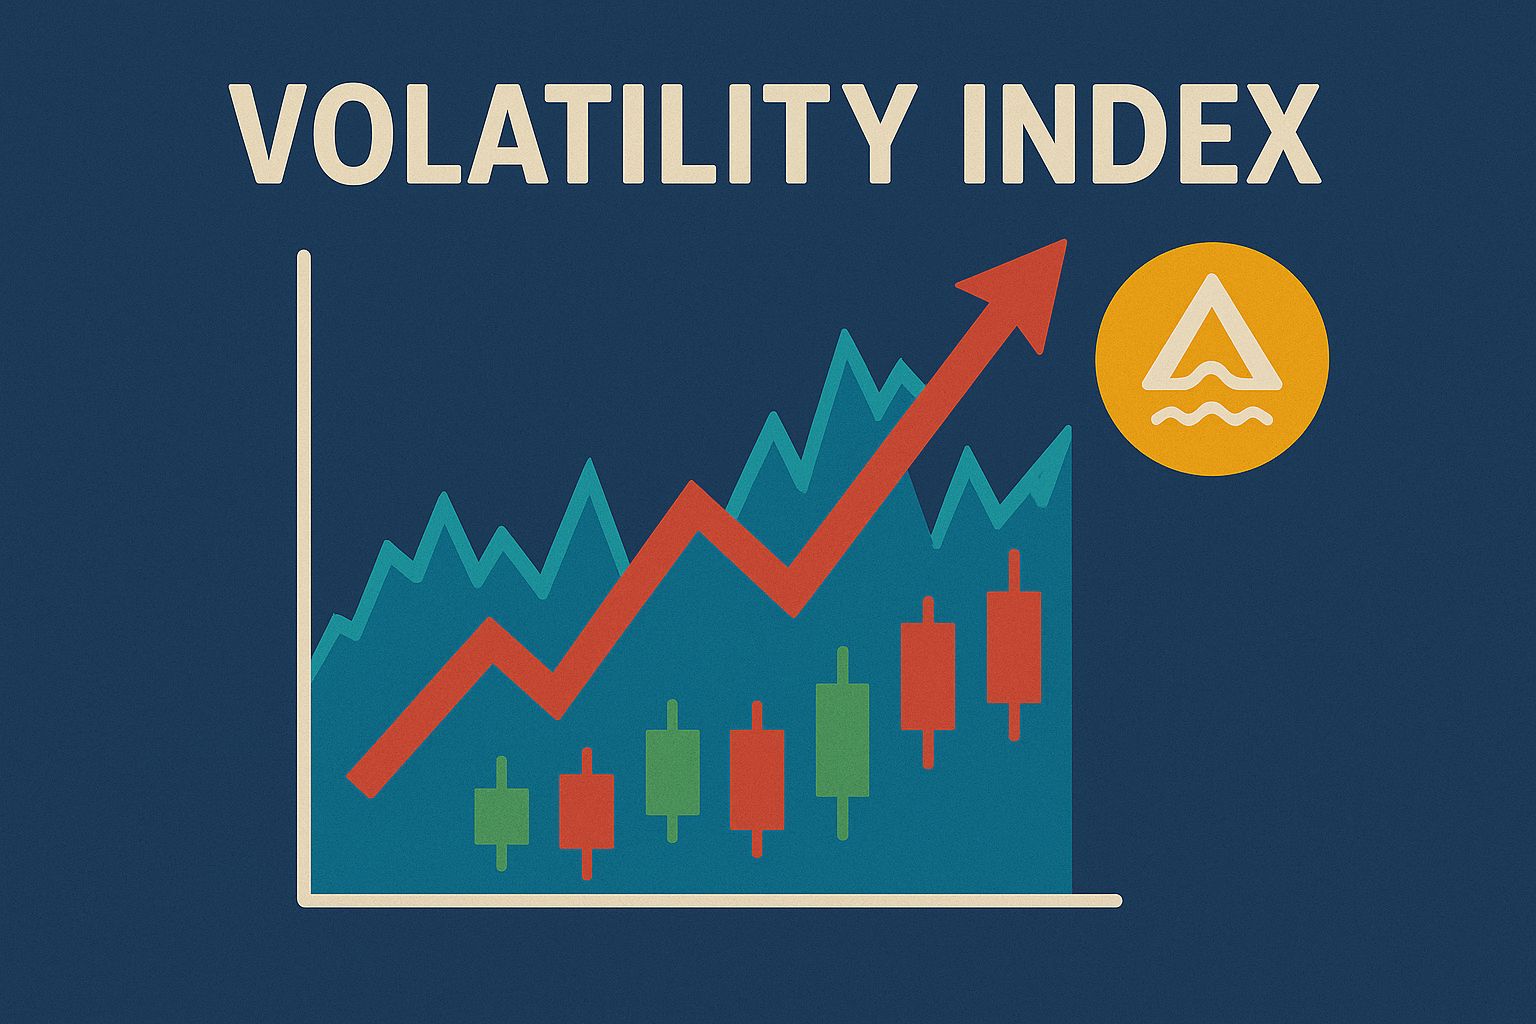
The Volatility Index, most commonly known as the VIX, measures the expected price swings in the US stock market over the next 30 days. It is calculated by the Chicago Board Options Exchange (CBOE) using options prices on the S&P 500 index. When traders pay higher premiums for options, it signals greater expected volatility, pushing the VIX higher.
Although “VIX” refers specifically to the US index, similar measures exist globally, such as the VSTOXX in Europe, the Japan VIX, and India’s VIX. Collectively, these indices represent the market’s heartbeat, fluctuating with fear, confidence, and speculation.
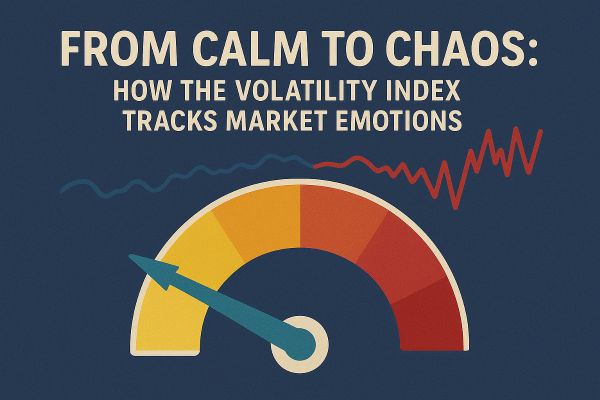
The VIX is often called the “fear gauge” because it reflects how worried investors are about the near-term outlook. When it rises sharply, markets tend to be in turmoil. When it stays low, investors feel confident and stable.
How the Volatility Index Reflects Market Emotion
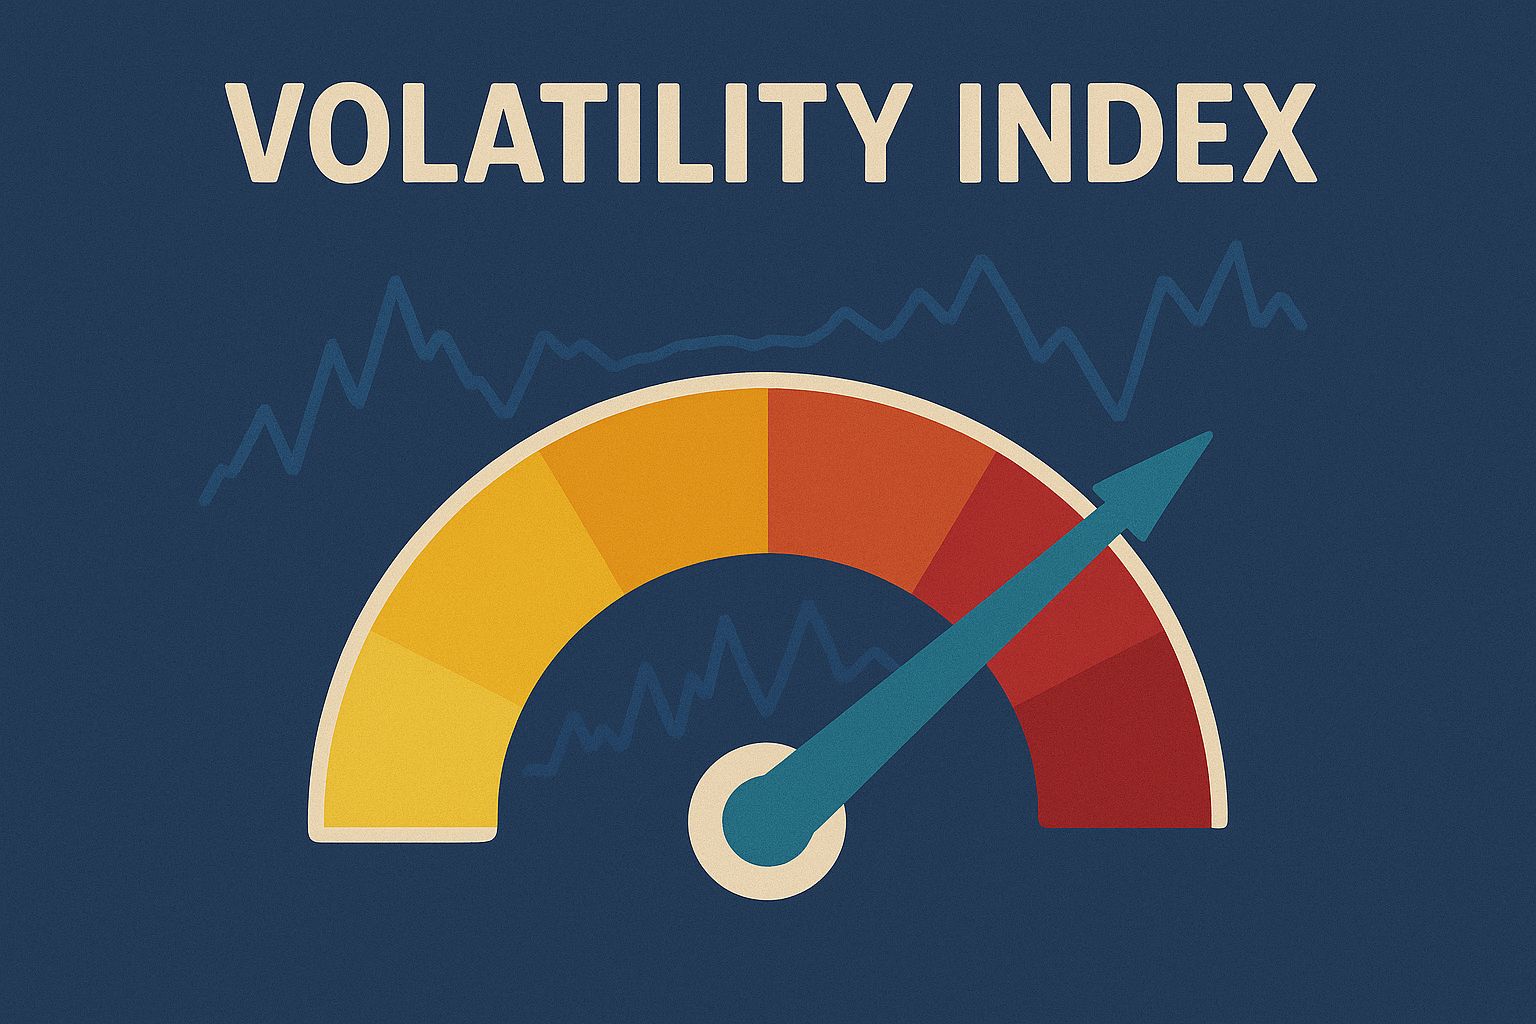
At its core, the VIX is a barometer of crowd psychology. A low reading, typically under 15, suggests complacency and confidence. Traders believe markets will remain calm. When readings climb above 25 or 30, it signals anxiety and uncertainty, often around events like interest rate decisions or geopolitical tensions.
In 2025, the VIX has ranged mostly between 14 and 20, mirroring a cautious optimism as inflation cools but growth slows. The highest spikes this year have occurred around surprise central bank announcements and energy price surges.
This emotional translation is what makes the Volatility Index so powerful. It doesn’t predict outcomes, but it quantifies expectation, and in doing so, it reveals the collective mood of the financial world.
Historical Case Studies: Calm vs Chaos
1. The 2020 COVID-19 Shock
When the pandemic hit global markets in March 2020, the VIX surged to 82.7, its highest reading since the 2008 financial crisis. Panic selling gripped investors as uncertainty about lockdowns and economic collapse spread. This spike illustrated the VIX’s role as a thermometer for fear, when uncertainty peaks, volatility follows.
2. The Banking Turbulence of 2023
In March 2023, the collapse of Silicon Valley Bank and stress in the US regional banking system triggered a brief but intense bout of market panic. The VIX rose above 30 within days, before falling back once the Federal Reserve intervened. This episode showed how swiftly fear can ignite, and how policy reassurance can calm it again.
3. The Tech Recovery of 2025
By contrast, 2025 has seen sustained periods of low volatility as major tech firms lead market gains. During mid-year, the VIX dropped to 13.9, one of its lowest points since 2019, suggesting traders expected stability despite broader macro uncertainty.
These episodes prove that the VIX acts not as a fortune teller but as a mirror of emotion. It rises and falls with perception, not just reality.
How Traders Use the Volatility Index
As a Sentiment Indicator
Traders view the Volatility Index as a measure of market emotion. When it rises sharply, many see it as a sign that fear has reached an extreme, potentially setting the stage for a rebound. Conversely, an unusually low VIX can indicate complacency and a market vulnerable to sudden shocks.
For Hedging and Protection
Portfolio managers often buy exposure to volatility when markets look too calm. VIX futures and ETFs act as insurance against large drawdowns. For instance, during the 2025 rate cut debates, some funds increased volatility hedges to guard against policy surprises.
For Timing Entry and Exit Points
Short-term traders use the VIX to refine entry timing. When the index jumps abruptly, it may suggest that panic selling is nearing exhaustion, presenting opportunities to re-enter at lower prices.
Global Versions of the Volatility Index
While the CBOE’s VIX tracks S&P 500 volatility, other markets have their own versions:
VSTOXX – measures expected volatility for the Euro Stoxx 50 Index.
Japan VIX – tracks Nikkei 225 options volatility.
India VIX – gauges market sentiment for the Nifty 50.
VHSI – the Hong Kong Volatility Index, reflecting Hang Seng expectations.
These indices tend to move together during global shocks, showing how interconnected modern markets have become. For instance, when the VIX spiked above 25 in June 2025 following inflation data, both VSTOXX and VHSI rose in parallel as risk sentiment tightened worldwide.
Common Misconceptions About the Volatility Index
It predicts market direction, it does not: The VIX tells traders how much markets are expected to move, not which way. A high reading can occur during both rallies and sell-offs.
A high VIX doesn’t always mean panic: Sometimes, elevated volatility simply reflects uncertainty ahead of major events like elections or economic reports, rather than outright fear.
It’s not directly tradable: The VIX itself is an index, but traders can gain exposure through derivatives such as VIX futures, options, or volatility-linked exchange-traded products (ETPs).
The Volatility Index in 2025: Facts and Figures
So far in 2025, the average VIX level has hovered around 16.8, above the 10-year median of 16 but below the 2020–2022 post-pandemic average of 21. Energy price swings and ongoing monetary policy uncertainty have produced intermittent surges above 23.
Meanwhile, data from the Bank for International Settlements indicates that global volatility correlations between the VIX and VSTOXX remain above 0.8, highlighting how sentiment spreads rapidly across markets.
Institutional portfolios increasingly use volatility as an asset class in itself, allocating small portions to volatility-linked funds to hedge against tail risks. This trend has expanded since 2022 as more investors recognise volatility’s diversification value.
FAQs About the Volatility Index
Q1. Why is the Volatility Index called the “fear gauge”?
Because it rises when investors pay more for protection, which happens during periods of fear and uncertainty. The higher the index, the greater the market’s collective anxiety.
Q2. What is considered a normal range for the VIX?
Readings below 15 indicate calm conditions, 15–25 suggest moderate caution, and above 30 signal high uncertainty or market stress.
Q3. Can traders use the Volatility Index for profit?
Yes, but indirectly. Traders use VIX futures, options, or ETFs to speculate on or hedge against changes in volatility. However, these instruments require experience and strict risk management.
The Big Picture
The Volatility Index reminds traders that markets are driven as much by emotion as by economics. It condenses millions of human reactions, fear, greed, relief, into a single measurable figure. Understanding its movements helps traders navigate uncertain times with perspective, not panic.
In 2025, where information flows faster than ever, the VIX remains a rare constant: a barometer for the world’s emotional temperature. Calm or chaos, it speaks the truth about what markets feel before they act.
Mini Glossary
Volatility: The degree of variation in asset prices over time.
Implied Volatility: The market’s forecast of expected price swings derived from options prices.
VIX Futures: Contracts allowing traders to speculate on or hedge against future volatility changes.
Hedging: Reducing risk exposure by taking offsetting positions.
Disclaimer: This material is for general information purposes only and is not intended as (and should not be considered to be) financial, investment or other advice on which reliance should be placed. No opinion given in the material constitutes a recommendation by EBC or the author that any particular investment, security, transaction or investment strategy is suitable for any specific person.
